


Montecito. Photo: Jak Wonderly.
California Reeling: When Mudslides Follow Wildfires
As 2017 ended, the Thomas Fire raged in the mountains flanking the Southern California town of Montecito. The new year had barely begun when a second disaster struck. On January 9, 2018 a torrent of mud, car-sized boulders and other debris barreled into the town. It was the middle of the night. More than 100 houses were destroyed. Twenty-three people died.
Southern California is already a hotspot for landslides on wildfire-ravaged slopes, and climate change is making these devastating events even worse. And Northern California, which so far has been largely spared from mudslides on burn scars, may be next. Reporting for KneeDeep Times, journalist Robin Meadows investigates the science of landslides that follow wildfires in California. What have scientists learned since then about the climate extremes that drove this catastrophe? Will science that is only now emerging yield tighter predictions of when and where post-fire mudslides will hit? The answers will help emergency services providers protect lives and property as these mudslides intensify in a warming world.
Extremes-in-3D
A five-part series of stories in which KneeDeep Times explores the science behind climate extremes in California, and how people and places react and adapt.
Supported by the CO2 Foundation and Pulitzer Center.
FULL READ
California Reeling: When Mudslides Follow Wildfires
It’s been nearly five years since a torrent of mud, boulders and debris slammed into Montecito, California, a Santa Barbara County town of 8,600 nestled between the Santa Ynez Mountains and the Pacific Ocean. It was the middle of the night. Twenty-three people died and at least 167 were injured. Hundreds were rescued, some lifted to safety by helicopter from the roofs of their homes. The slide destroyed more than 100 houses and damaged another 300.
“I heard this noise I never will forget,” says Montecito resident Curtis Skene, who woke in the early hours of January 9, 2018 to a deafening rumble and the sound of trees snapping. “CRACK! CRACK! CRACK! CRACK! It was like firecrackers but every crack was a tree breaking.”
Moments later the side of his house ripped open and mud poured in. Skene raced outside, barefoot in his pajamas in the cold of winter, and scrambled up an olive tree on the other side of his house.
The rest of the night was just as surreal. The earth shook. The bright orange glow of a burning gas main lit the sky. A car floated past in slow motion. Sixty-foot palm trees went by as if they were toothpicks. “I was freezing my tail off for five hours, listening to my neighbor scream for help but I couldn’t get to him,” Skene says. “We lost four lives within 100 yards of my house.”
The mix of mud and everything it picked up while barreling toward Skene’s neighborhood is called a debris flow. While many debris flows are small, the term doesn’t begin to convey what Skene experienced.
“Envision an avalanche launching off the mountains and destroying everything in its path,” he says.
Montecito resident Curtis Skene. Photo: Jak Wonderly.
One of the most powerful and dangerous types of landslides, debris flows can travel tens of miles per hour and transport boulders as large as tow trucks. They’re triggered by bursts of rain, and mountains with recent severe burns are particularly at risk partly because the soil becomes water-repellent. Instead of soaking into the ground, rainfall beads up and shoots across the surface, picking up soil.
Southern California is already a global hotspot for debris flows on wildfire-ravaged slopes. Climate change, which intensifies fire and rain, is making them even worse. And while Northern California had historically been spared from mudslides on burn scars, now these devastating events may be on the rise there too.
The 2018 debris flow was the second that Skene lived through in this house, which was also his boyhood home. The first also followed a wildfire and struck on January 25, 1969, when he was 15 years old. His family’s house was fine that time. With the help of friends, Skene and his father had sandbagged the exterior to a height of four feet, and the mud crested at three feet. “My father and I ran to a plate glass window and saw the mud rising,” Skene says. “He grabbed me but then it started to subside.” Afterward he heard a county official assuring residents that this would never happen again.
So the 2018 debris flow, which carried boulders up to 20 feet across and buried the six lanes of Highway 101 in up to 12 feet of mud, came as a shock. Skene’s first thought was extreme gratitude to be alive. His second was, “What the hell am I doing in my house again — I’d seen this as a kid!” His next thought was there must be something he could do.
EXTREMES-IN-3D
A seven-part series of stories in which KneeDeep Times explores the science behind climate extremes in California, and how people and places react and adapt.
Series Home
Click here to enter
Part 6: Infrastructure
Part 7: Aftermath
Supported by the CO2 Foundation and Pulitzer Center.
At a community meeting on the disaster, he met Tom Fayram, then Santa Barbara County’s head of flood control, and the two teamed up to protect Skene’s neighborhood from future debris flows.
In parallel, scientists dove into the why and how of the deadly Montecito debris flow, using it as a case study to identify the climate extremes that drove it and to tighten predictions of when, where and how hard these catastrophic events will strike. What they’ve learned since then will help weather forecasters and emergency services providers protect lives and property as post-fire debris flows intensify in a warming world.
Extremes Run Amuck
The cascade of climate extremes behind Montecito’s debris flow began with the 2012-2016 drought, one of the hottest and driest in California’s recorded history. “There was a huge die-off of vegetation,” says Alexander Gershunov, a climate scientist at Scripps Institution of Oceanography. The severe drought killed a lot of trees, and dry wood catches fire easily and burns hot and fast.
Then the drought ended, and the state swung between extremes in a single year. The winter of 2016-2017 was one of the wettest on record and the summer of 2017 was then the hottest on record. So first the grasses grew like anything and then they all dried up. On top of that, while California’s wet season typically begins in the fall, it didn’t rain for the rest of the year.
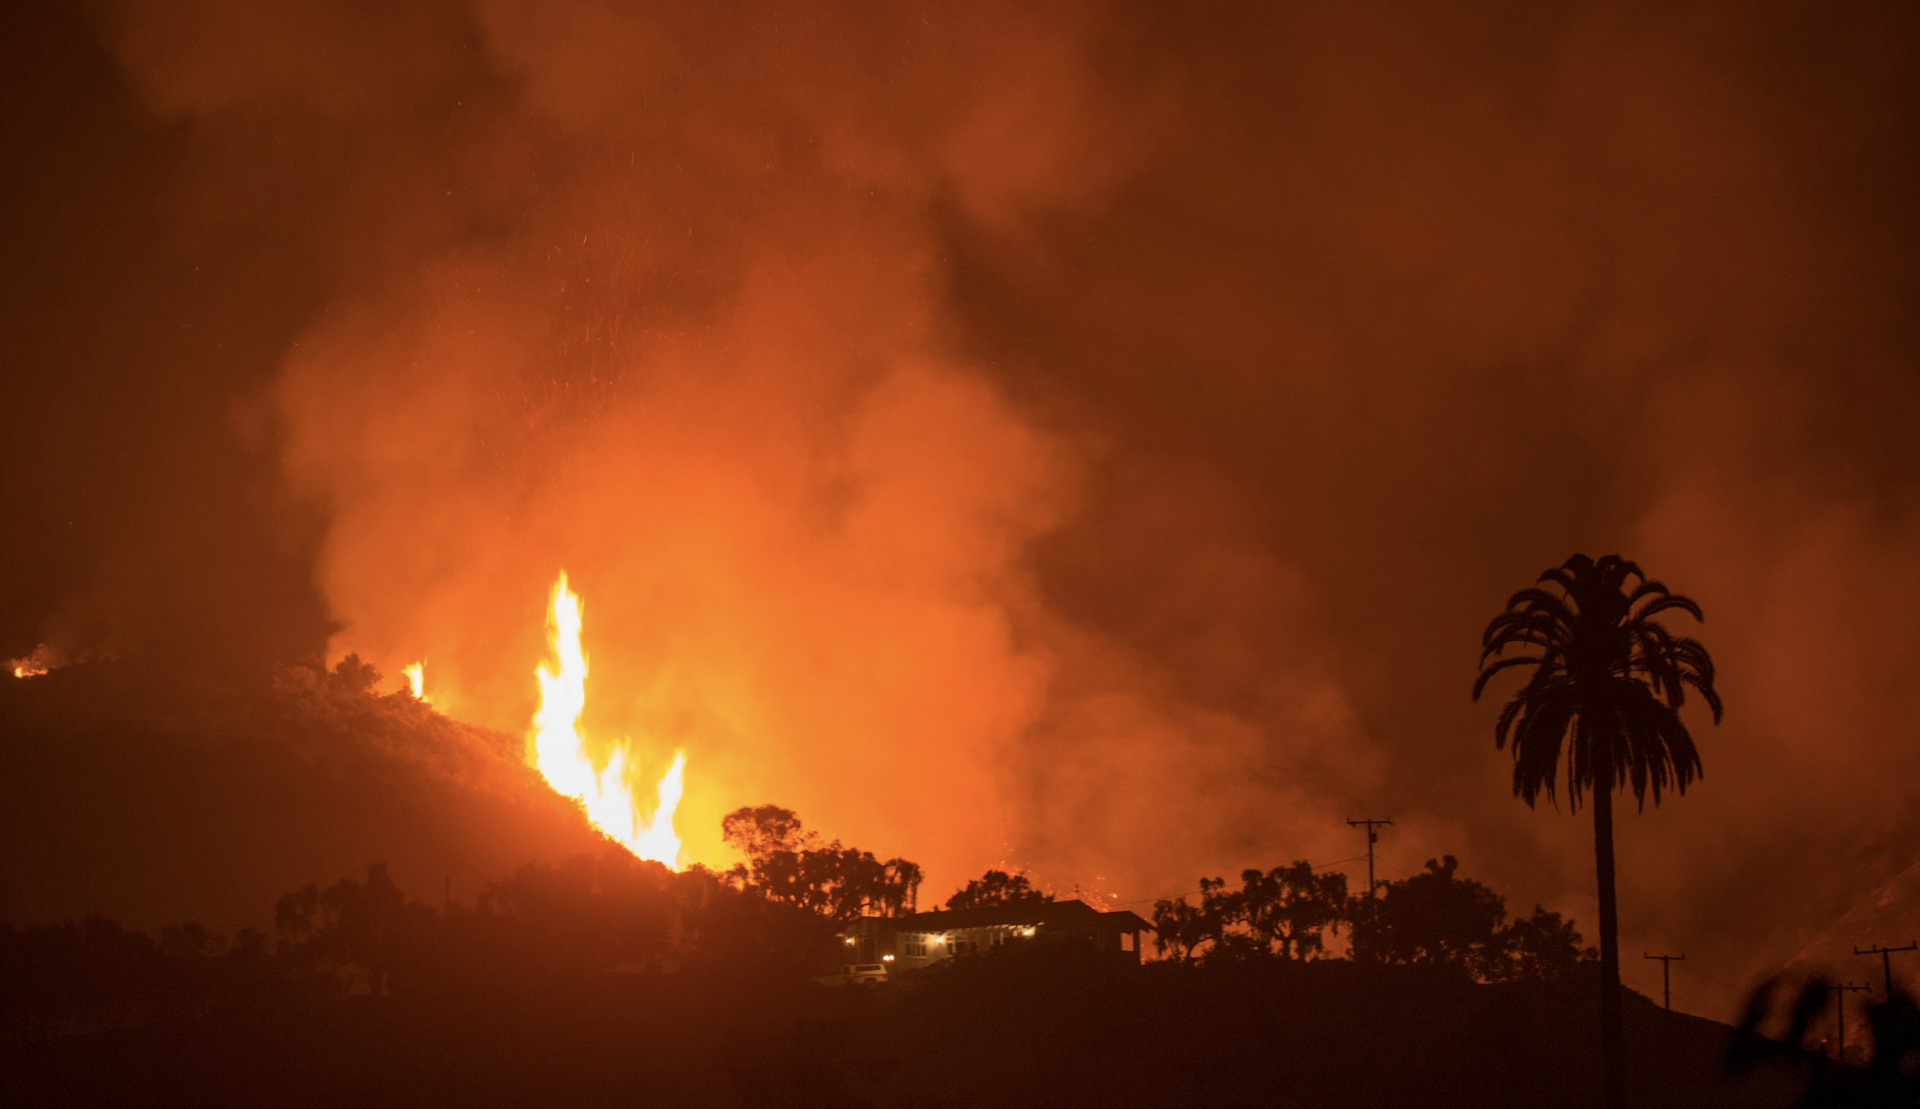
Thomas Fire in 2017. Photo: Wikimedia Commons.
Instead, the landscape became even more parched. “There was an extreme heat spike in October — it was hotter than summer,” says Gershunov, who has lived in Southern California since childhood. The autumn heat overlapped with strong, dry winds called Santa Anas that blast down Southern California’s coastal mountains starting in the fall and peaking in December. In Northern California these are called Diablo winds.
All it took to ignite the desiccated vegetation was a few sparks from power lines in the mountains above Santa Paula, a town 40 miles from Montecito, on December 4, 2017. “When those sparks occurred, it was like a tinderbox,” Gershunov says. “It was super flammable.”
Back-to-back Santa Anas, typical late in the year, fanned the flames. The blaze, called the Thomas Fire, started near the top of a canyon and the first Santa Ana blew fire down it and toward Montecito. “The wind was roaring and the canyon funneled the wind,” says Gershunov, who helped investigate the fire.
The next Santa Ana, gusting up to 60 miles per hour, spread the fire even further. The Thomas Fire grew to 281,893 acres and burned for 38 days, making it the largest wildfire in California’s history at the time. Today it is only the eighth largest. The Thomas Fire still smoldered in the mountains above Montecito when the first rains came on January 9, 2018 and set off the debris flow.
Climate change heightens the risk that the extreme conditions behind wildfires and post-fire debris flows will converge again. Summers are hotter and the dry season lasts longer, pushing fire season into the height of wind season. The Santa Anas that send fires raging down canyons towards communities are also getting worse. Infamous for setting people on edge — novelist Raymond Chandler said they “make your nerves jump and your skin itch” — these relentless arid winds also bring increasing dread of infernos.
Santa Anas can be cold or hot depending partly on the weather in the Great Basin between the Sierra Nevada and Utah’s Rocky Mountains, where they originate. Only the hot ones spread big wildfires. “In coastal California, some of the hottest conditions are produced by Santa Ana winds,” Gershunov says. “It can be 80 to 90⁰F in December.” A 2021 study he led shows that cold Santa Anas are waning while hot ones are becoming hotter and more frequent.
“Everything came together during the Thomas Fire,” Gershunov says. “It’s a harbinger of future coastal wildfires.”
Bursts of Rain
Climate change is also making atmospheric rivers — the storms that deliver much of California’s precipitation — wetter. An atmospheric river is a jet of extraordinarily wet air that shoots across the ocean and drops its moisture on land. And it doesn’t even take a huge storm to cause a major debris flow on a burn scar.
“That’s a big misconception,” says climate scientist Nina Oakley, a colleague of Gershunov’s at Scripps Institution of Oceanography.
The Montecito flow was triggered by a brief but intense rainband in a weak atmospheric river, according to a 2018 study she led. A rainband is a narrow strip of heavy rain, and this one formed along the storm’s cold front. Then strong winds forced it up the mountain slopes behind the town. In just 15 minutes, more than one inch of rain fell on the Thomas Fire burn scar right above Montecito.
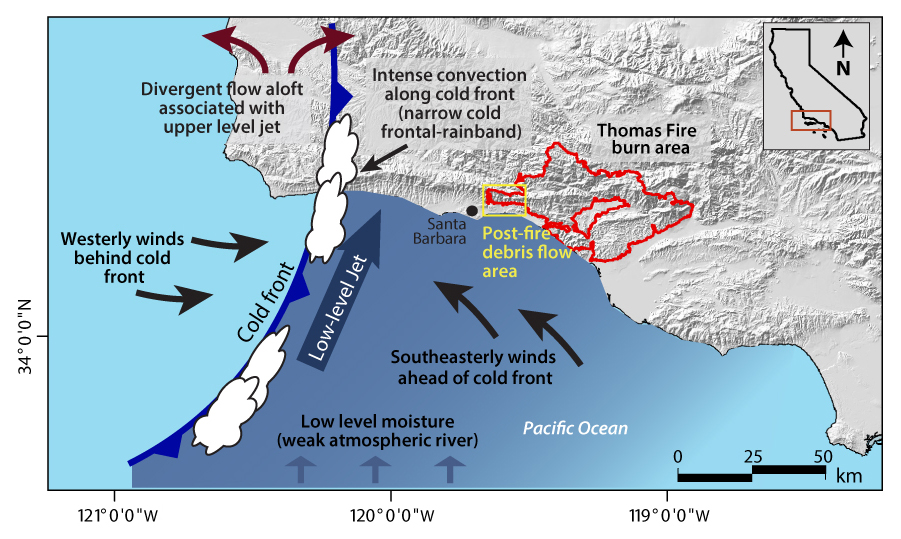
In the middle of the night on January 9, 2018, winds blew a narrow strip of intense rain or rainband (white clouds) along a cold front (blue line) toward Montecito. When the rainband reached the mountains above town, it dumped a quick burst of heavy rain on the Thomas Fire burn scar (red line), triggering a debris flow. Source: European Geosciences Union.
“It’s all about short-duration, high-intensity rainfall,” Oakley says. “It can rain for days without a debris flow, and then a little thunderstorm brings extreme rain and triggers one.”
Oakley, who grew up in Santa Barbara County, was dismayed when a high school friend said the flow was caused by a freak rain storm. Not so. The area already experiences heavier bursts of rain, she says, adding that “with climate change, everything points to rainfall intensification.”
Intense rainbands near cold fronts occur all along the California coast, and a 2022 study Oakley co-authored found that about three make landfall per year in Southern California. These rainbands are only a couple of miles wide, making it challenging to predict where they will be at any given moment. As a first step toward forecasting them in real time, Oakley and colleagues have launched a database that details associated weather conditions to help get a handle on how they form and develop.
Montecito’s Stop Gap
Skene’s neighborhood, which is on San Ysidro Creek, was one of the hardest hit by the burst of rain on the Thomas Fire burn scar that propelled colossal flows of mud and debris down several canyon creek beds in Montecito. After the community meeting on the calamity, Skene visited flood control expert Fayram in his office. There Skene learned about debris basins. These enormous engineered holes in the ground are often deployed by Southern California counties to help capture the flow of mud and boulders that rushes down canyons during storms.
Skene then scouted locations for a basin to protect his neighborhood and found the perfect site on Randall Road near the mouth of San Ysidro Canyon. But the county balked at the $4 million price tag for the property. Installing a debris basin, at an additional $15 million, was even farther out of reach.
In hopes of making the debris basin a reality, Skene co-founded a non-profit called Partners in Community Renewal with architect Kris Kirkelie, who he calls his sweetheart. Skene, a venture capitalist who’s spent much of his life at the intersection between dollars and dreams, knew how to make his dream come true. “I used my entrepreneurial skills to persuade the county to buy the lot on Randall Road and leveraged that to apply for a FEMA [Federal Emergency Management Agency] grant for the debris basin,” he says. Fayram was with him the whole way.
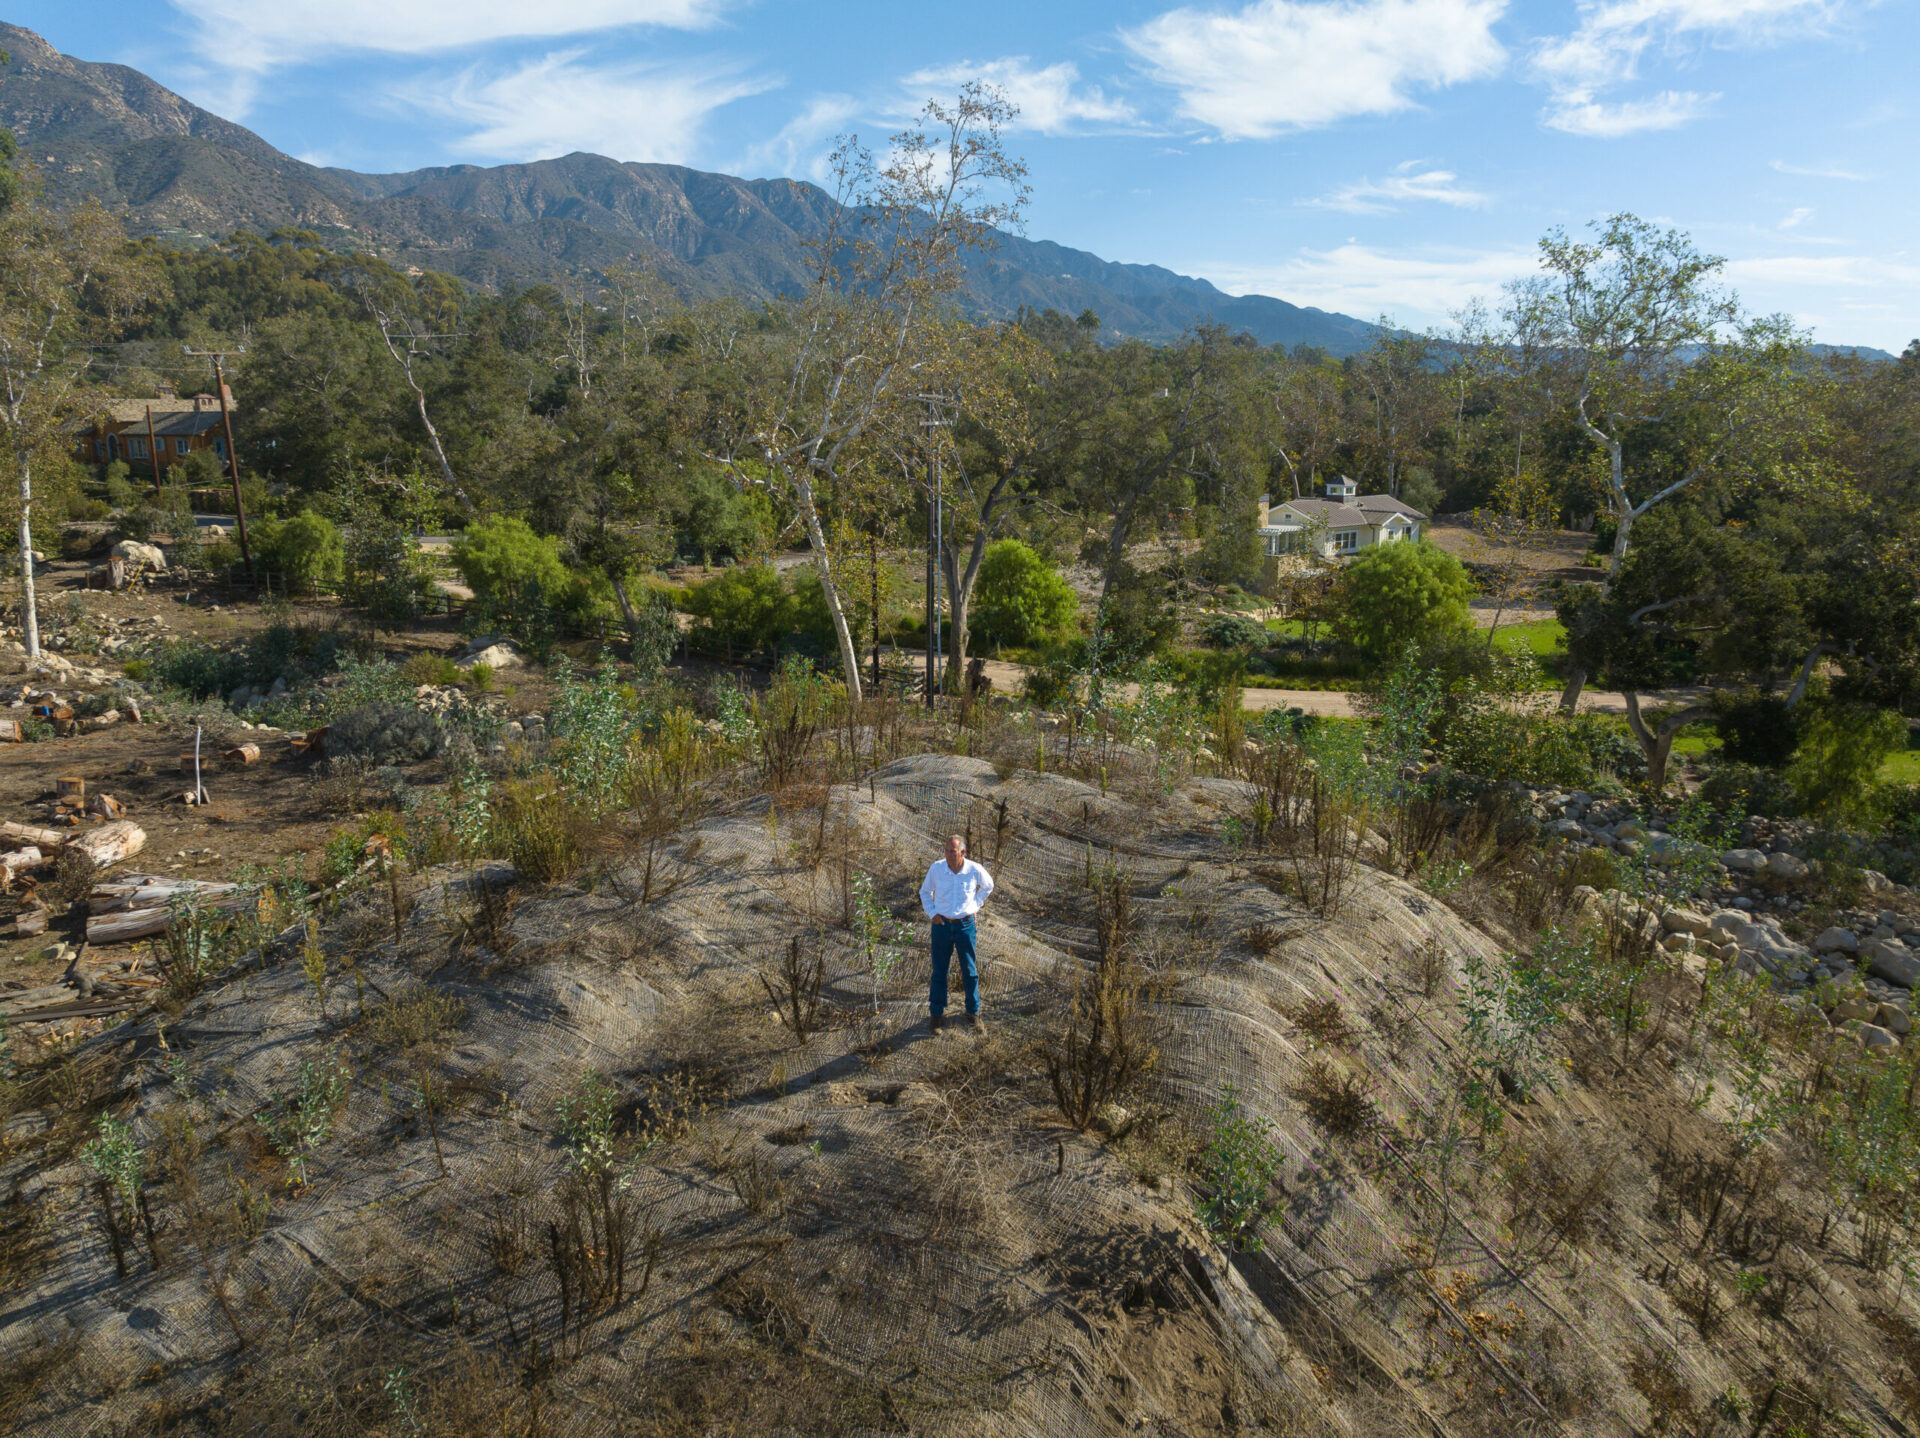
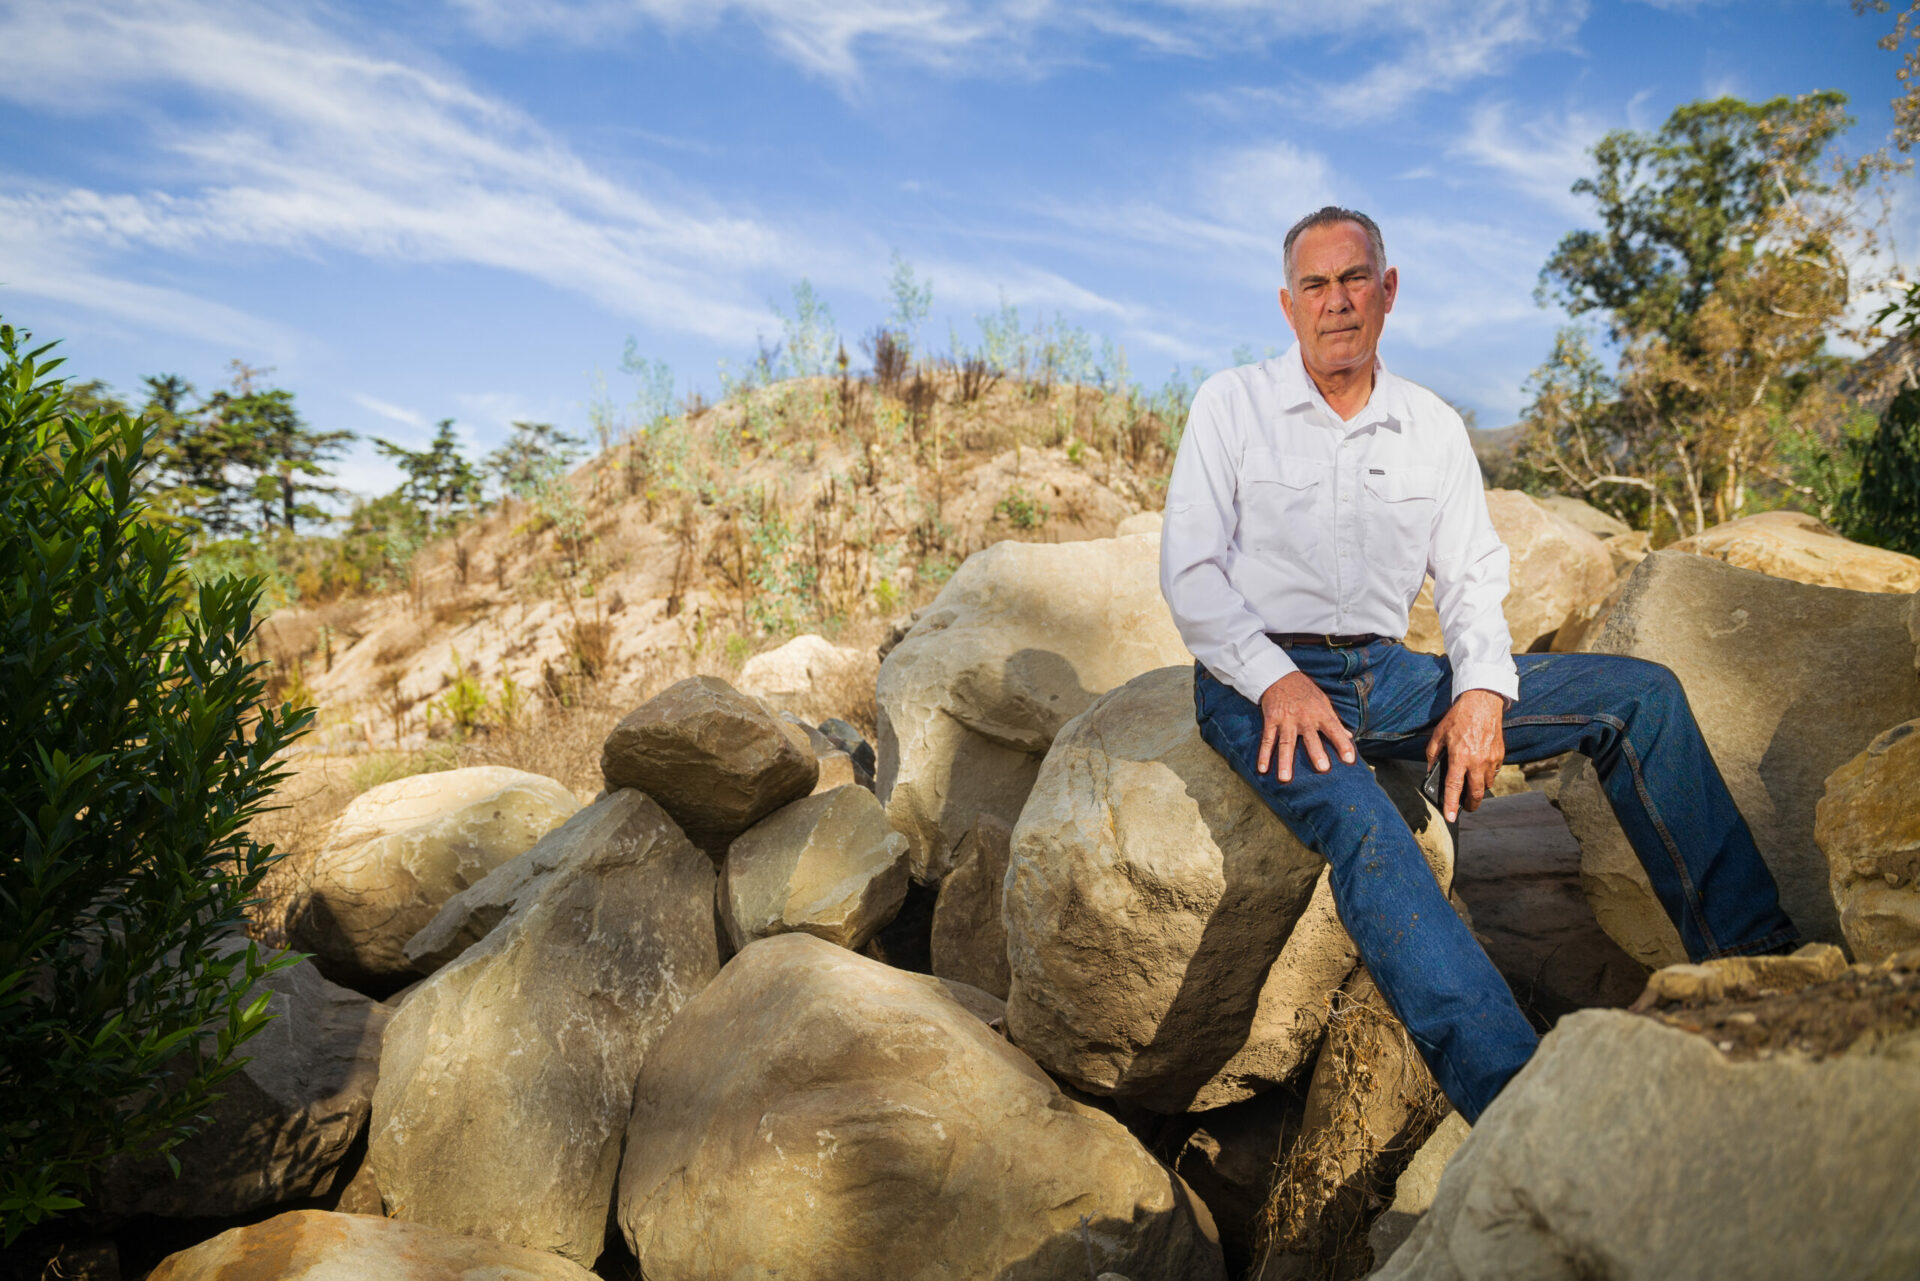
Skene stands on the mound of debris he plans to use to raise his house, when he rebuilds. Photo: Jak Wonderly
It took Skene and Fayram several years and several in-person meetings to get it done, and it started with his state senator. The turning point came when Skene presented the financial case for the Randall Road debris basin to her chief of staff. “The economic impact of the debris flow was enormous,” Skene says. “It wasn’t just a small neighborhood that was affected — Highway 101 was closed for two weeks.” Many businesses went bankrupt because no one could get to them, and many people lost jobs and or half a month’s wages.
The cost of debris removal and damages to homes and infrastructure exceeded $1 billion dollars by early 2020 and was likely to top $1.5 billion once all the insurance claims had been filed, estimated a 2021 study led by Jeremy Lancaster, the California Geological Survey lead on debris flow hazard mapping.
The economic argument leapfrogged the debris basin on Randall Road from 53 to 5 on FEMA’s project list. So in 2019 Skene and Fayram flew up to Oakland to meet with FEMA officials. “We pitched them the debris basin and they gave us full funding,” Skene says, still sounding amazed. After the basin was completed in the summer of 2022, FEMA officials told him that they saw it as a model project because it was initiated locally and exemplifies the agency’s shift from cleanup to mitigation and adaptation.
Scrutinizing the Science
Scientists knew the risk of a debris flow in Montecito was high. But they were surprised that it was so big. About 890,000 cubic yards of sediment from mud to sandstone boulders came crashing down the mountains, enough to fill the Rose Bowl stadium in Pasadena twice over, making it one of the largest known flows in the state. “No one expected a debris flow that size,” says UC Santa Barbara geologist Paul Alessio, a co-author of The Geological Society of America’s 2020 field guide to the Montecito debris flow. “Looking at field data later clued us in to why.”
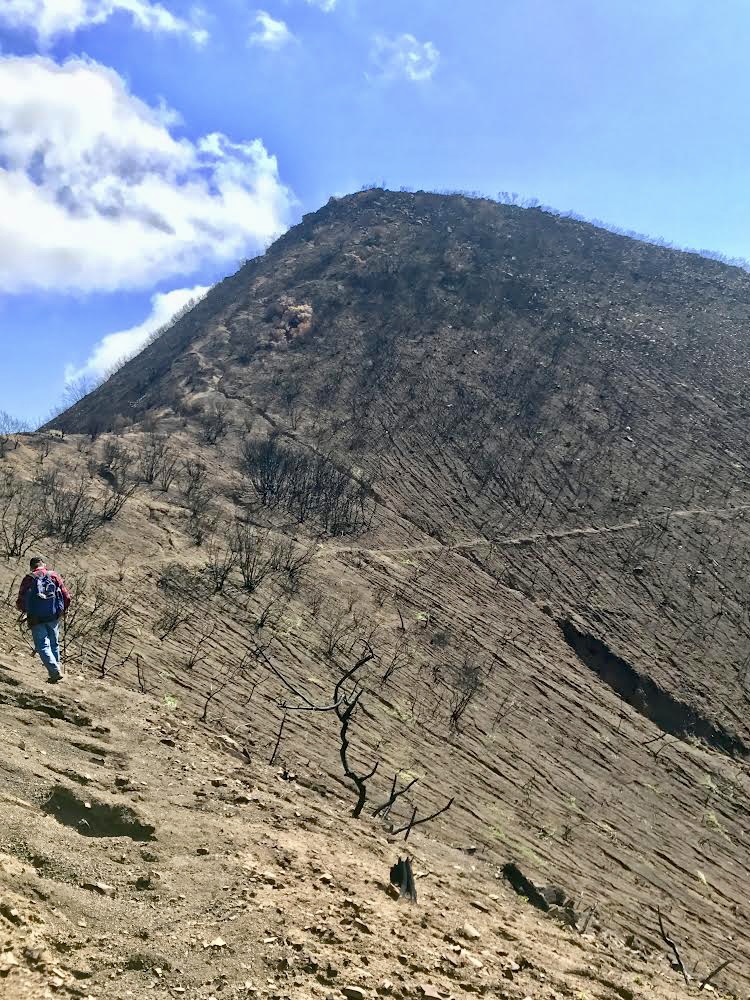
The Santa Ynez Mountains tower over Montecito, rising sharply to nearly 4,000 feet. Jagged and almost unbelievably steep, the range is studded with nearly vertical sandstone outcrops. This creamy golden rock looks like it’s just waiting to tumble down. Indeed, some geologists describe these mountains as wanting to become the beach, which is mere miles from their base.
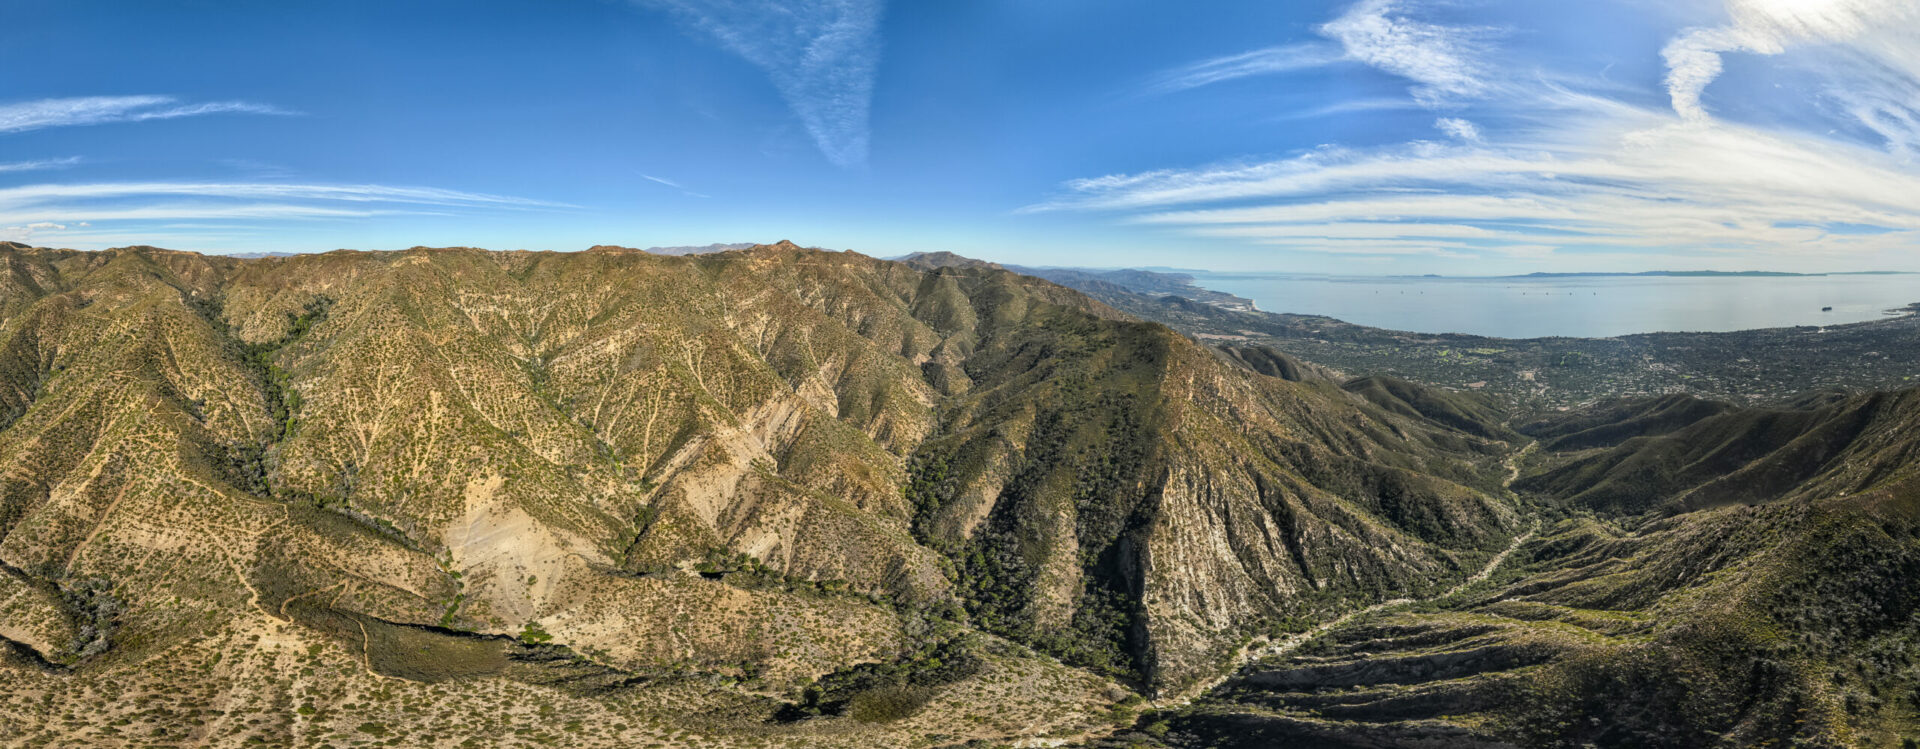
Photo: Jak Wonderly.
Looking down, Montecito seems very far away. But barely 20 minutes elapsed between the burst of rain up here and the debris flow’s arrival down there. “It took 10 minutes to make the mud and 10 minutes to get it downhill,” says Alessio, who investigated what happened in that brief interval. Understanding how debris flows form is critical to improving predictions of these disastrous events because once one starts, it’s already too late to alert people in its path.
A series of small creek catchments — irregular bowls rimmed by precipitous ridges — sit atop of the mountains right above Montecito. The bowl that drains into the creek that runs through Skene’s neighborhood is one of the largest but still doesn’t quite reach 3 square miles.
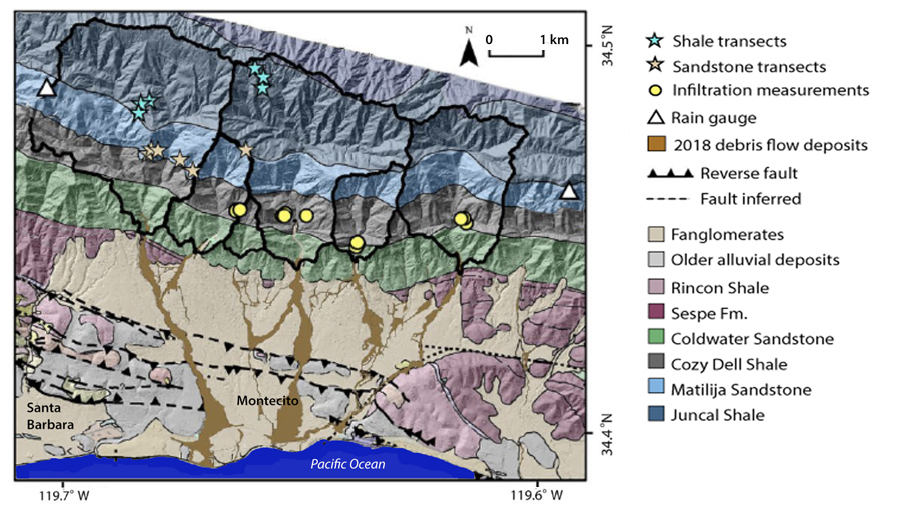
The six creek catchments (outlined in black) at the top of the mountains above Montecito are full of shale (blue-grey). On the night of the 2018 debris flow, a burst of rain scored the shale with tiny channels called rills that delivered huge amounts of mud to the creek channels, resulting in a debris flow (tan) that reached the ocean. Source: AGU.
Today the bowls are thick with chaparral and scrub. But in early 2018 the Thomas Fire had just burned all the plants away, baring the soil.
Underneath the soil lies bedrock, including a crumbly, deep purple shale that readily falls apart into tiny pieces. When Alessio went to the top of the mountains shortly after the debris flow, he saw that the fragile shale in the bowls was incised with small, closely packed channels called rills. “They were made by rain flowing down the slope,” he says. “There were thousands and thousands of rills in a bowl of sediment, turning it into mud.” Networks of rills formed rapidly, within the first few minutes of intense rain, and efficiently sent a huge volume of mud down canyons, found a 2021 study Alessio led.
Rills in creek catchment. Photo: Paul Alessio
Once the mud entered the creek channels, it swept up boulders that had been deposited by previous, smaller debris flows. Three-dimensional, laser-generated images of the creeks before and after the flow revealed that it transported about 720,000 cubic yards of boulders, found a 2021 study Alessio co-authored.
“It was the perfect set-up for a debris flow,” Alessio says, stressing the need to document the sediment loaded in creeks above Montecito and other at-risk communities.
Another unknown was which parts of Montecito were most at risk. “One of the things missing was an accurate depiction of where flows would go,” says Jason Kean, the US Geological Survey lead on post-fire debris flow hazards. There wasn’t time after the fire and before the first rain to model that. Instead, floodplain maps were used as a proxy for identifying high-risk areas. But while bridge culverts and underpasses handily channel floodwater, they can’t cope with sediment. Debris quickly plugged this infrastructure, shunting the fast-moving flows into neighborhoods outside flood zones.
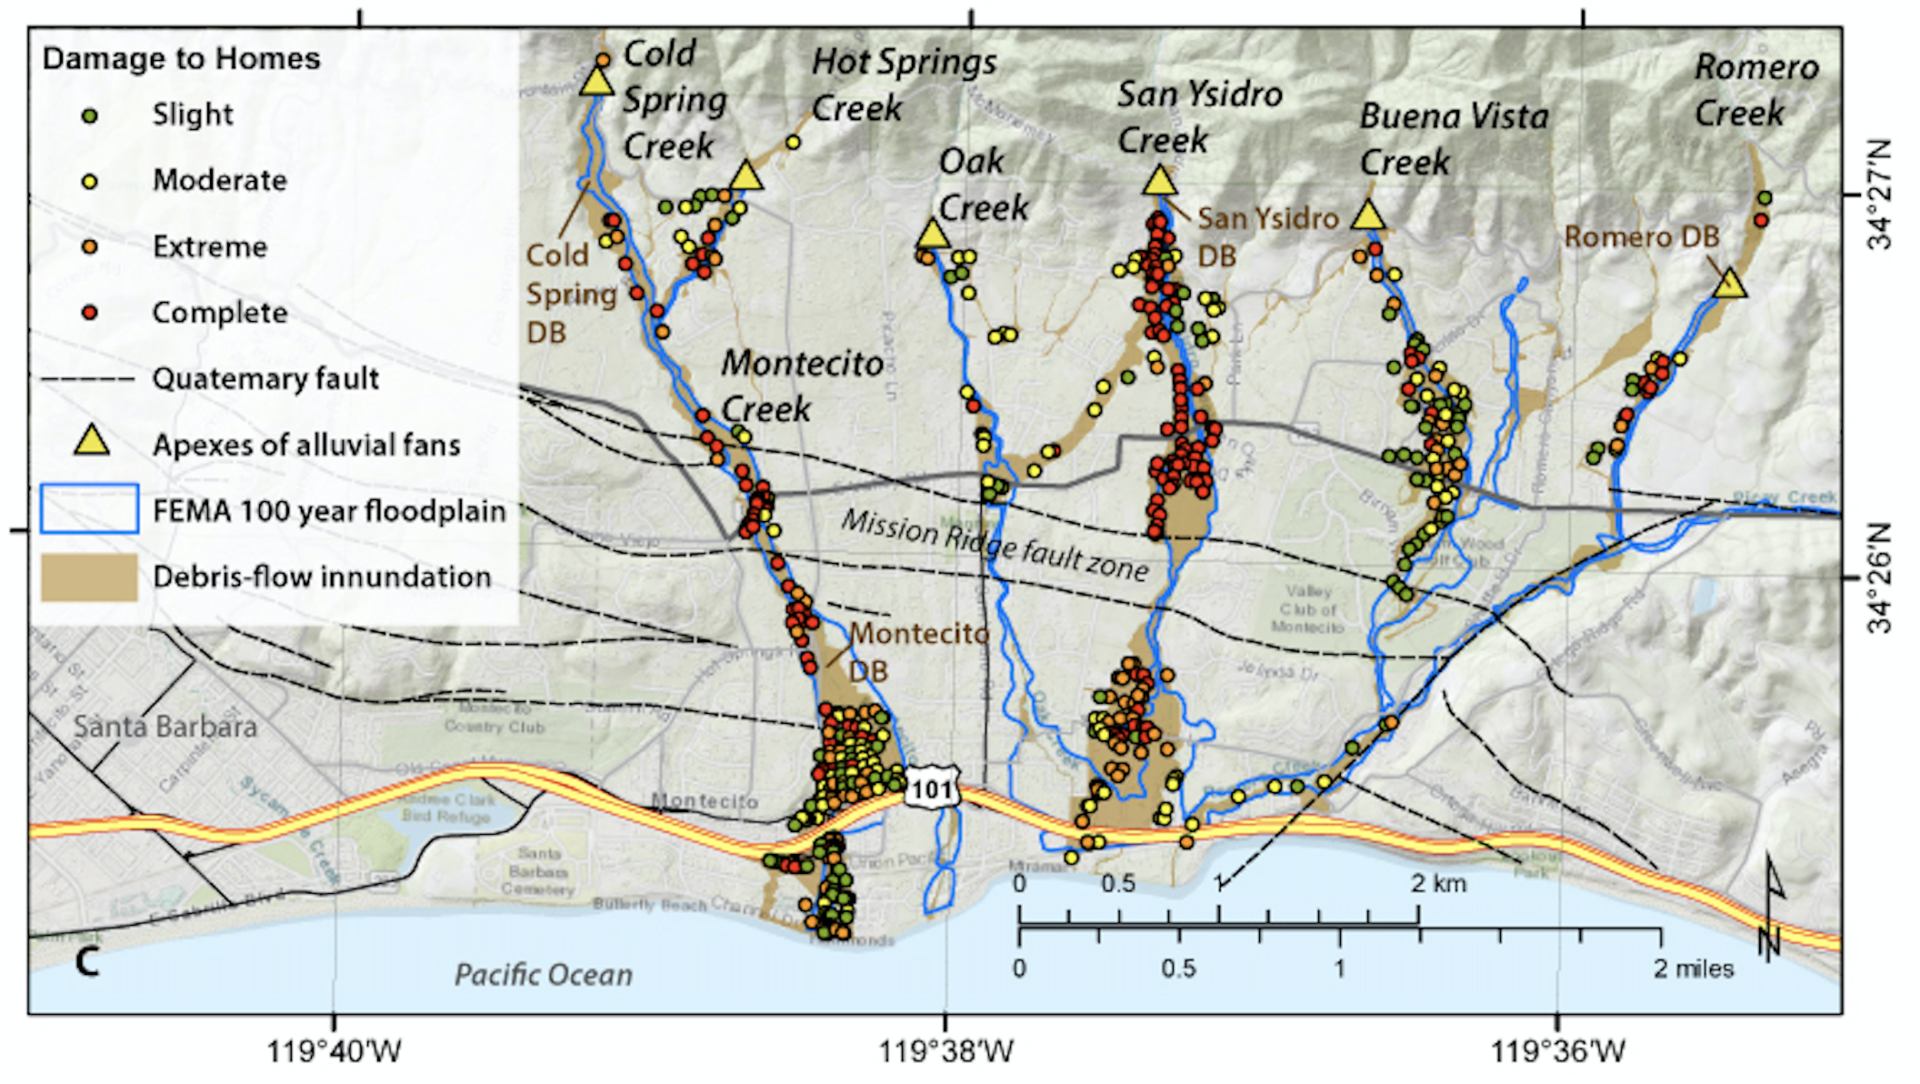
More than 400 houses were damaged (green and yellow circles) or destroyed (orange and red circles) along the paths of the 2018 Montecito debris flow (tan). Much of the damage was outside the FEMA 100-year floodplain zones (blue lines) that had been used to assess risk before the debris flow. Source: GeoScienceWorld.
Kean led a team that mapped the flow paths and took field measurements of factors including sediment depth and boulder size. The data in their 2019 study will help scientists assess future debris flow risks, from triggering conditions on mountain peaks to downstream hazard zones, and develop models that predict where they will spread in the built environment.
Is Northern California at Risk?
While Southern California has a long history of frequent post-fire debris flows, Northern California (apart from some Central Coast slides), is essentially uncharted territory for these events. “I grew up in Southern California and we had fire season and debris flow season, but you rarely heard about fires in other parts of the state,” says Patrick Barnard, a USGS coastal geologist. “Now fires and post-fire debris flows are happening elsewhere in the state every year.”
2021 was particularly bad, with massive flows along the Central Coast and in the Sierra Nevada. In January, an atmospheric river set one off on the River Fire burn scar above Salinas, damaging dozens of homes and trapping people inside. The same storm caused even bigger flows on the Dolan Fire burn scar in Big Sur, including one that tore out 150 feet of Highway 1, leaving it impassable for months.

Big Sur debris flow on the Pacific Coast in 2021. Photo: USGS.
In July, a debris flow from the Dixie Fire burn scar shut down 46 miles of Highway 70 in the Sierra Nevada. As in Montecito, it was triggered by a quick burst of intense rain, in this case from a thunderstorm.
So far, though, coastal Northern California has been relatively unscathed by debris flows after wildfires, with only small ones in the Santa Cruz Mountains. “The question is, can we have an event as impactful as Montecito in the North Coast Ranges?” says Oakley, who lives in Sonoma County.
“We don’t know,” says the California Geological Survey’s Lancaster. But Northern California’s risk could rise as climate change worsens both wildfires and rainstorms. “There’s been a significant increase in the size and severity of fires in Northern California, exposing new landscapes to the possibility of post-fire debris flows,” says Kean.
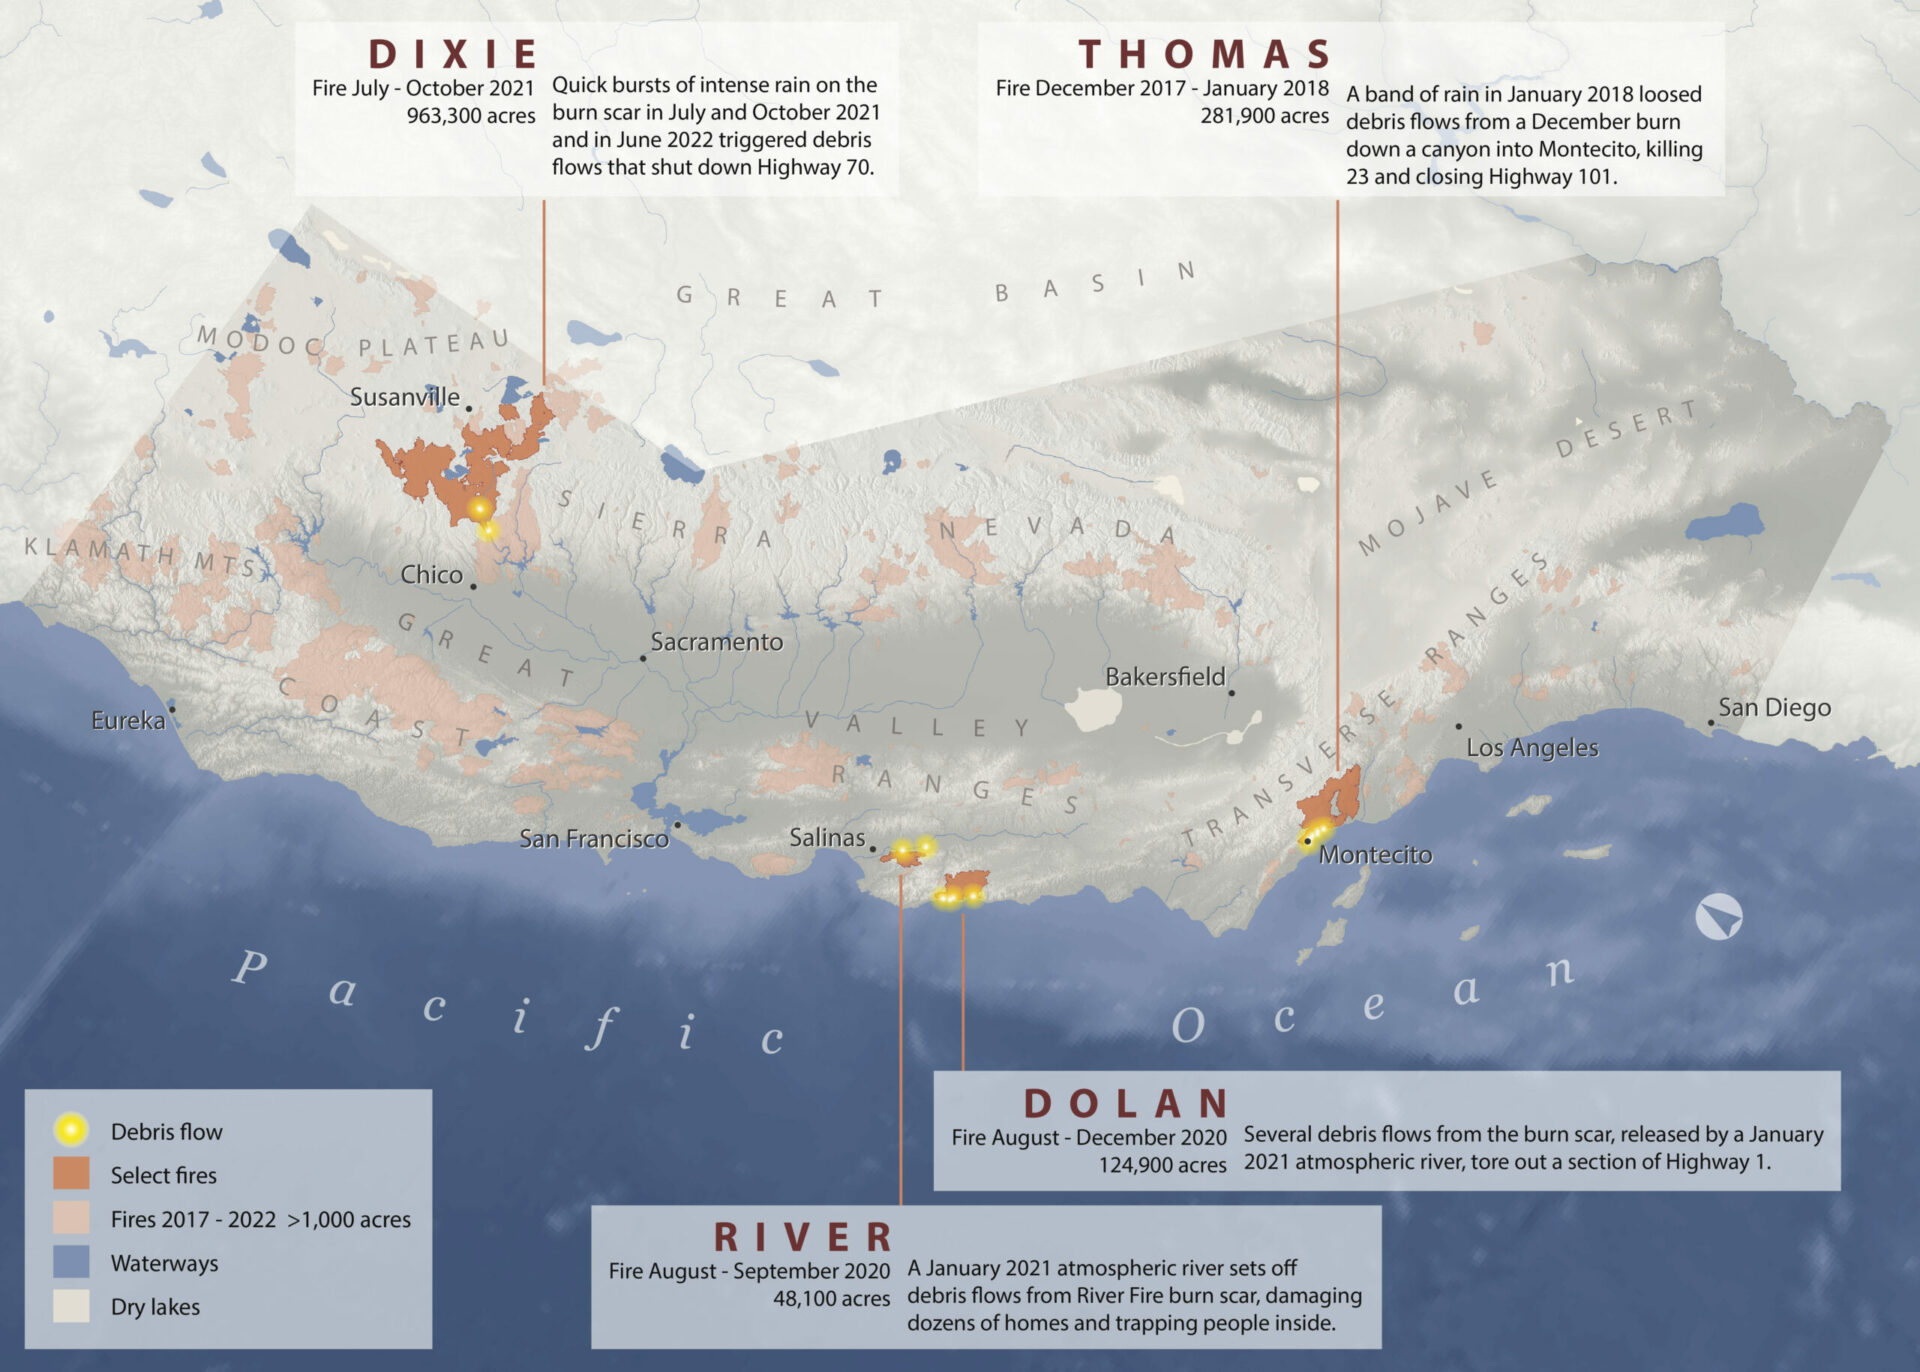
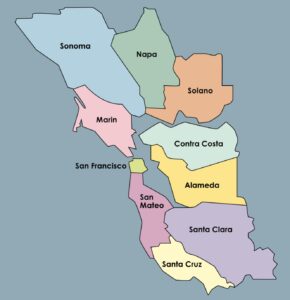
Fires from January 2017 to October 2022 larger than 1,000 acres shown. Highlighted fire areas had significant debris flows when major precipitation events happened shortly after fires. Map: Amber Manfree.
Matthew Thomas, a USGS hydrologist who works with Kean, is working with Oakley on rainfall projections in Northern California. He’s excited that newer climate models can predict rain in 15-minute increments. This is a huge advance over past models, which could only predict rainfall by the hour, and will help researchers identify the conditions that trigger flows on burn scars.
While more intense rain is likely in Northern California, Thomas cautions that this won’t necessarily translate into more flows. “The geology and landforms are different in Northern California,” says Thomas, who grew up in the San Francisco Bay Area and adds as an example that North Bay slopes are not as steep as Big Sur.
Debris flow risks are usually assessed after wildfires. But climate change is shrinking the window between the two hazards. “In Montecito there wasn’t enough time between fire and rain,” Kean says. “We need to be proactive.” He envisions debris flow risk maps much like FEMA’s flood risk maps.
Lancaster shares this vision. High-resolution LIDAR (laser), which is much sharper than current imaging, is at the top of his list for assessing debris flow risks in advance. “We need statewide coverage,” he says. “You can see thick soils in canyons that could move in a rainstorm, and landscape features that suggest activity, like fresh boulder fields near canyon mouths.”
Small, disadvantaged communities are a priority for these risk assessments. “They can be disproportionately affected by hazards because they lack staff and funds to prepare and respond,” says Lancaster.
Rebuilding Safely
Skene’s neighborhood doesn’t look like a dangerous spot to the casual eye. The land is mostly level, and seems well enough away from the foot of the mountains and San Ysidro Creek. But just before the terrain flattens, the creek takes a sharp left — and the flow kept going straight. It overshot the banks, heading right down Randall Road. “By the time the debris flow got there, it was a 40 foot wall of mud with the biggest boulders in front going 40 miles per hour,” UC Santa Barbara’s Alessio says. Skene’s street was next in its path and it ultimately went all the way to the ocean.
The morning after the debris flow, Skene’s neighborhood looked “like a moonscape,” he says. The flow tore his house apart, taking the back side one way and the garage another way. He lost almost everything and was grateful when someone several miles away found a packet of letters his parents had written each other. He hasn’t been able to read them yet though, he says, tearing up. Many of his neighbors’ homes were also destroyed, and Skene stops at each empty lot to remember who lived there.
But the olive tree that saved Skene’s life still stands and his neighborhood is recovering. Crews rebuilding homes and neighbors greet Skene, who has just returned from a trip, with joy. Thanks partly to his efforts, they know their community will be better adapted to weathering the next big flow their future holds.
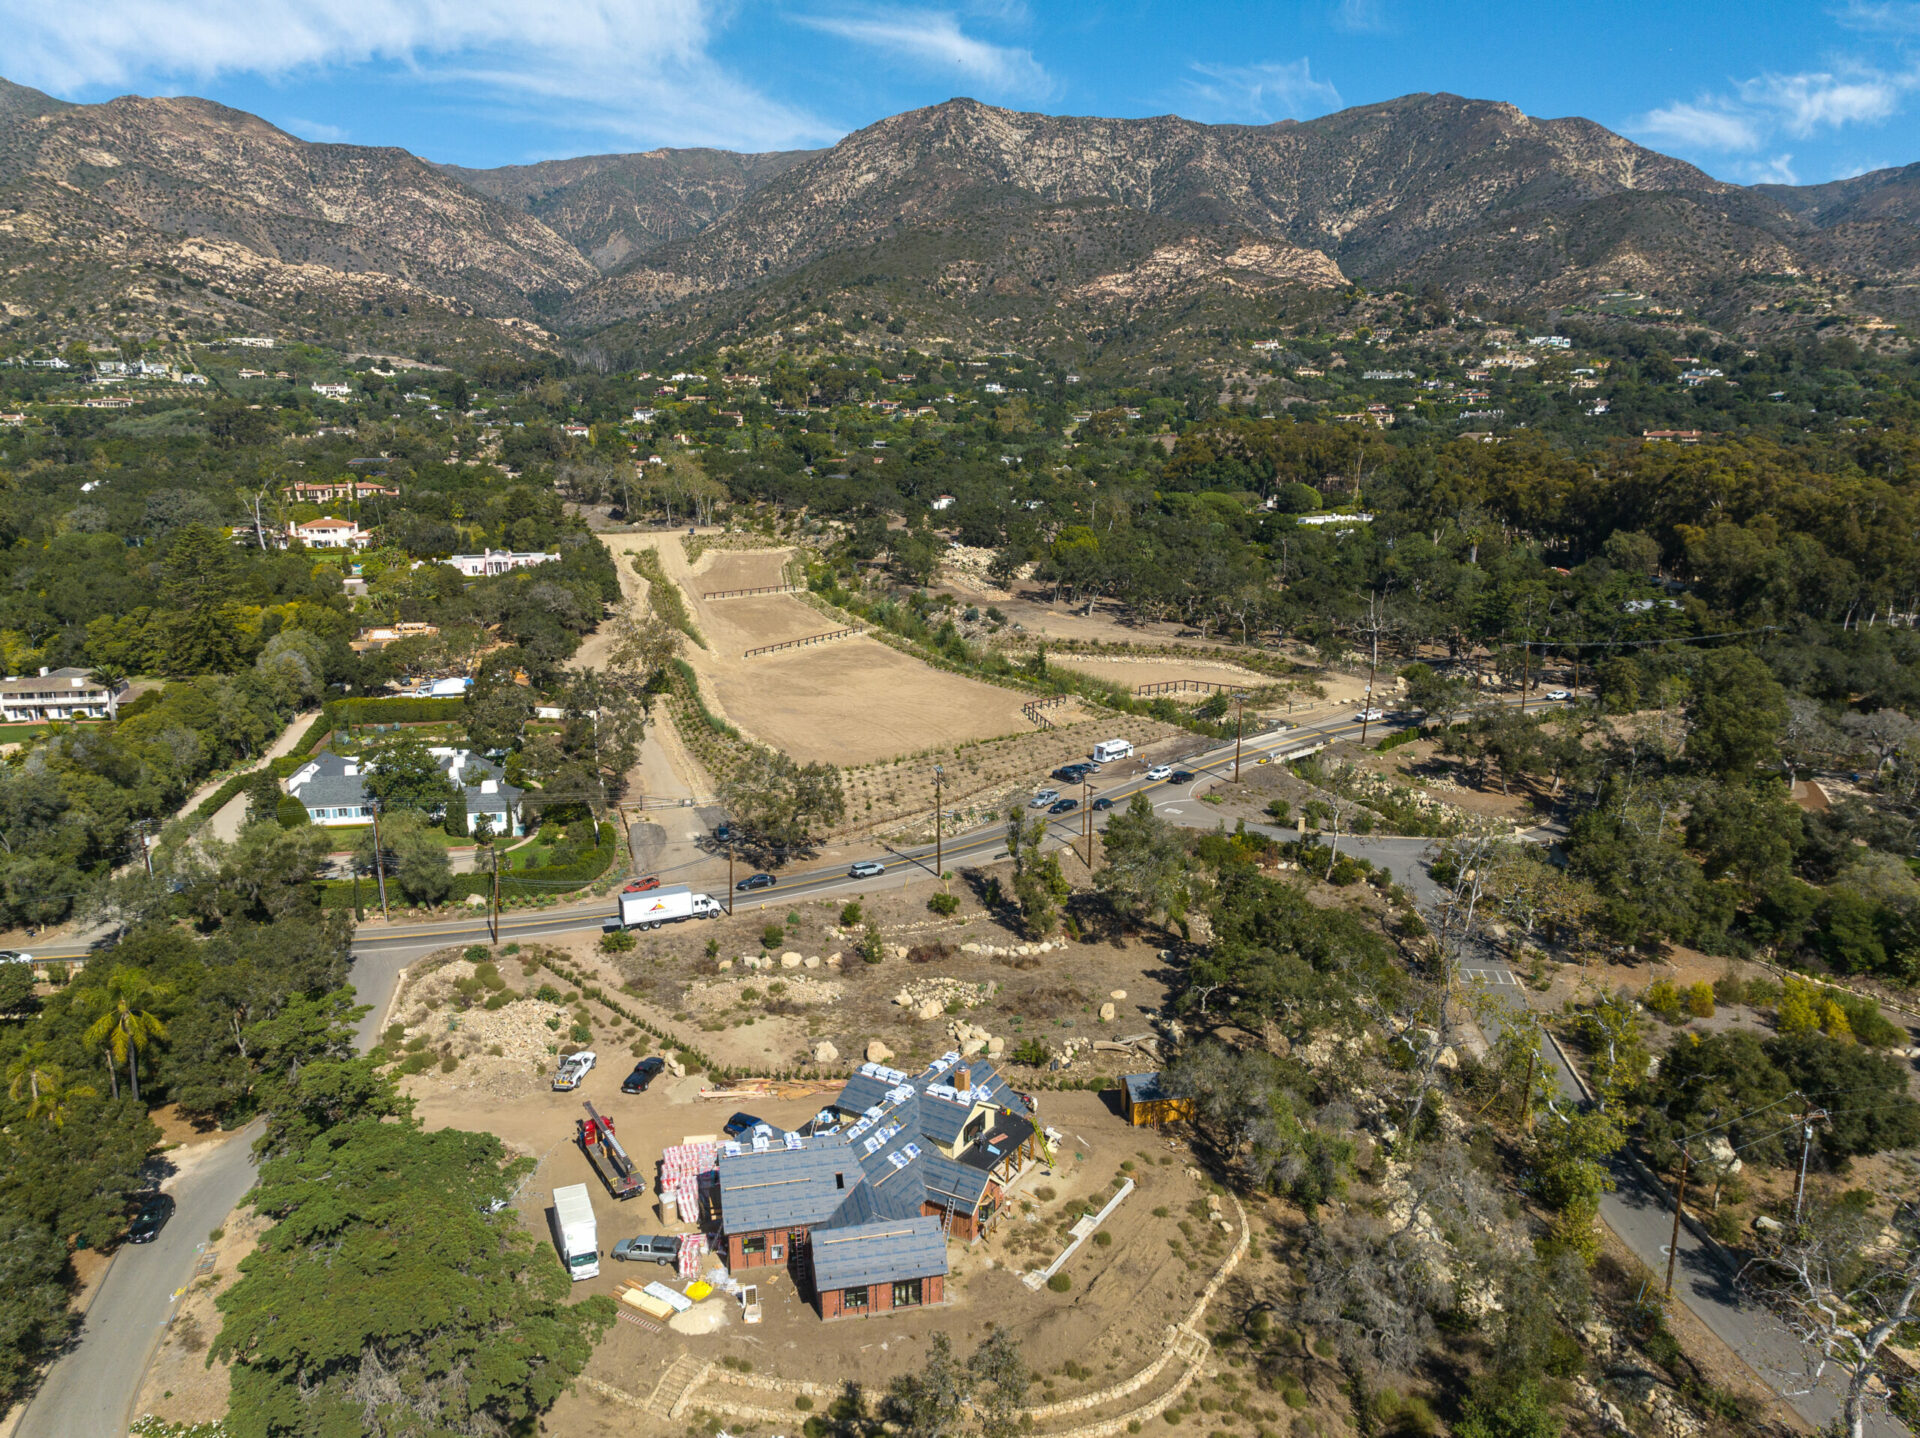
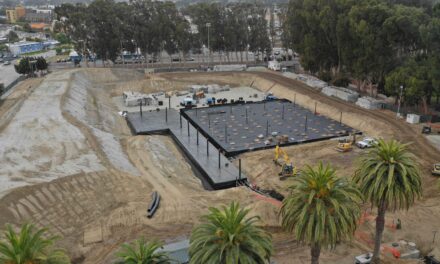
Debris basin constructed near Skene’s house, with a neightbor’s house rebuilt on “protective” pad at bottom. Photo: Jak Wonderly.
It’s a short walk from Skene’s lot to the debris basin that will help protect his neighborhood in the future. The basin sits where seven houses once stood on Randall Road and has a capacity of 100,000 cubic yards. It’s also equipped with several rows of sturdy metal racks to catch boulders.
The new basin isn’t big enough to capture a repeat of the 2018 flow, when nearly 390,000 cubic yards came down San Ysidro Creek. But it will slow a flow that size and let the boulders settle out, making any overflow from the basin less destructive. As a further protection, houses are being rebuilt on dirt pads that are elevated as high as 10 feet. “The houses will be on little islands,” Skene says. “When the next debris flow comes — and it will come again — the mud will go to either side.”
Skene plans to rebuild too, using a gigantic mound of sediment left by the flow to raise his new house. Between the insurance claims and construction permits, he expects it will take another four years of red tape, but he’s undeterred. “I grew up here,” Skene says. “This is my home.”
EXTREMES-IN-3D
SERIES CREDITS
Managing Editor: Ariel Rubissow Okamoto
Web Story Design: Vanessa Lee & Tony Hale
Science advisors: Alexander Gershunov, Patrick Barnard, Richelle Tanner
Series supported by the CO2 Foundation.
Reporting supported by Pulitzer Center, Connected Coastlines.
Special thanks for California Reeling
Jak Wonderly, Photography
Amber Manfree, Fire Map
Darren Campeau, Science Graphics Support

