
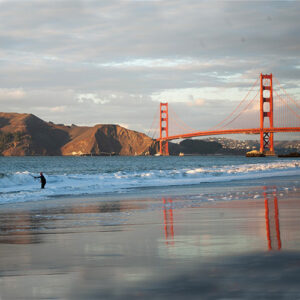

Photo: Katie Rodriguez.
Beach Loss Looms for the California Coast
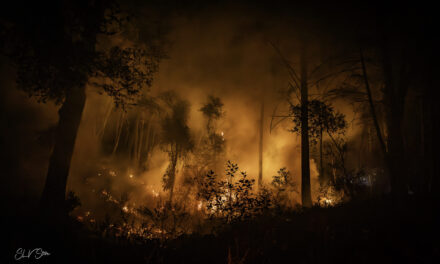
Even though Dan Hoover’s been rolling up and down the same stretch of San Francisco’s Pacific coast for 15 years, it never looks the same. In summer it’s wider and flatter. In winter, with the pummeling from storms and winter waves, it narrows. Hoover drives an ATV with a GPS strapped to the front, which records the elevation and extent of the shifting sands beneath his tires. With climate change, not to mention El Niño this year, scientists say the beach will erode more than ever. “El Niño is all the buzz right now,” says coastal geologist Patrick Barnard of the U.S. Geological Survey. One “nature-based” source of new materials for eroding coasts could be rivers like the San Lorenzo in Santa Cruz. Other more engineered interventions, like one planned for San Francisco’s oceanfront sewage plant, require more negotiation and management. The coast, meanwhile, is on the move.
Extremes-in-3D
A five-part series of stories in which KneeDeep Times explores the science behind climate extremes in California, and how people and places react and adapt.
Supported by the CO2 Foundation and Pulitzer Center.
FULL READ
Beach Loss Looms for the California Coast
Everybody wants Dan Hoover’s job. Once a month he drives up and down Ocean Beach on an ATV. Sometimes he climbs on a jet ski instead, running lines through the tumbling combers. When he applied for the job, they asked him how he felt about big waves. He just grinned.
“I surf,” he told me later.
Even though Hoover’s been rolling or skimming up and down this four mile stretch of San Francisco coast for 15 years, the beach never looks the same. In summer it’s wider and flatter. In winter, with the pummeling from storms and winter waves, it narrows.
On the sand, Hoover follows the contours, eyeballing the “mountains and valleys” to plot his course. His job is to survey the elevation and extent of the beach for the U.S. Geological Survey. Hoover drives, and the GPS strapped to the front of his ATV records the elevation of the shifting sands beneath his tires.
EXTREMES-IN-3D
A seven-part series of stories in which KneeDeep Times explores the science behind climate extremes in California, and how people and places react and adapt.
Series Home
Click here to enter
Part 6: Infrastructure
Part 7: Aftermath
Supported by the CO2 Foundation and Pulitzer Center.

Photo: Katie Rodriguez.
“It’s like driving a pencil around on the beach, tracing all the features,” says the former aerospace engineer. The GPS collects data twice every second. Over the course of the day, it generates 50-100,000 data points. “We stick the data in a computer and it connects the dots, producing a 3D map of the beach surface. And we compare that map to the map from a month ago, and the month before that.” The data tell them how much the beach is eroding or accreting (building up) and how wide it is at the time. The USGS has been doing this same beach survey for two decades. Data from Ocean Beach is used all over the world to build better models for how beaches change, and better predictions to feed into coastal and erosion management practices.
On the back of Hoover’s four-wheeler flaps a sign: “Research Study.” Everyone on the beach — dog-walkers, families, fishers, tourists — is curious about what he is doing.
“After the Fukushima earthquake, they thought we were looking for radiation. Now they think we work for Google, that we’re driving around taking pictures,” he says. “Talking to folks is super fun, most of them only visit the beach now and then and have no idea how much it changes seasonally or year-to-year.”
El Niño Could Eat Away at Our Coast This Year
Hoover drove his most recent survey on Jan. 9, 2024. On that day, the beach was smooth, planed flat by two days of huge surf over the holidays. The ocean is always reshaping and taking away bits of the beach and moving the sand around, both onshore and offshore underwater, and also up and down the coastline. With climate change, not to mention El Niño this year, it will do it even more.
Federal weather agencies confirmed clear signs of an official El Niño year months ago. At press time the official index was trending upwards, suggesting this year’s event could soon join the ranks of the top four strongest ever recorded.
“El Niño is all the buzz right now, and we’re trying to get more beach surveys done before the storms settle in,” says USGS coastal geologist Patrick Barnard, who runs the research program Hoover works for. “The last one in 2015-16 was one of the strongest in 150 years and we observed extreme beach erosion across the state. This one is expected to be comparable.”
El Niño is an atmospheric and ocean circulation pattern in the tropical Pacific, during which trade winds weaken or reverse. The pattern produces more storminess over the North Pacific and along the West Coast. According to a 2015 USGS paper in Nature Geoscience, wave energy was about 30% higher during past El Niño winters, and erosion 90% higher across the West Coast beaches. According to another paper in Nature Communications, during the 2015-2016 El Niño, the seasonal erosion at Ocean Beach doubled, and most West Coast shorelines retreated beyond “previously measured landward extremes, particularly along the sediment starved California Coast.”

El Niño erosion of Ocean Beach. Results from USGS surveys comparing the beach at its widest and highest in October 2015 with its most eroded and narrowest in March 2016, after an El Niño winter. Red and yellow colors are erosion, and blue and green accretion. Chart: USGS.
Add sea level rise and the outlook worsens. In a 2022 article, Barnard’s colleague Sean Vitousek describes a model his team developed, based on satellite images, that can predict shoreline response to waves and sea level rise across more than 1,094 miles of the California coast. The model suggests California will lose 24-75% of its beaches by 2100. Add rain that falls heavy and runs off fast, causing additional coastal inundation and erosion like that produced by some of the atmospheric rivers that soaked the Bay Area and Santa Cruz so badly last winter, and we’re in for it.
“Things tend to blow up with these kinds of winters. First, we have all of these dynamic processes riding on top of incremental sea level rise, a chronic issue. And then we have a really big El Niño winter, and all of a sudden it can be borderline catastrophic for coastal infrastructure,” says Barnard.
Barnard warns this will be a season of big waves, big storms, and more wave energy and erosion than normal. “We’re pretty confident there’ll be significant pressure on the coast this winter, with the storms around New Year the first major blow, and possibly an early indication of what we are in for,” he says.
 months between January 1950–May 2023 (ENSO refers to the El Niño Southern Oscillation which includes La Niña). Recent decades are mostly warmer than earlier decades due to human-caused global warming. But because of the vast area of the tropical Pacific, El Niño periods (blue bars) tend to be warmer than La Niña periods (green bars) compared to other months and years in the same decade. Source: NOAA NCEI image.")
Global surface temperature in El Niño, La Niña and other (ENSO neutral) months between January 1950–May 2023 (ENSO refers to the El Niño Southern Oscillation which includes La Niña). Recent decades are mostly warmer than earlier decades due to human-caused global warming. But because of the vast area of the tropical Pacific, El Niño periods (blue bars) tend to be warmer than La Niña periods (green bars) compared to other months and years in the same decade. Source: NOAA NCEI image.
But really, with a coast that already changes so much naturally, as waves claw away at beaches, cliffs and coves, and as tides and waves move sediment and water in and out, and up and down the coast, why worry? This landscape was made to adapt naturally.
The worry stems from all of the buildings and roads and utilities people have constructed on the coast, of course.
“California is right at the tipping point,” says Barnard. “We’re built on this razor thin margin along the coast, and it doesn’t take much — just one serious storm — to demonstrate just how vulnerable we are. Last year’s storms were amplified by the 8-10 inches of sea level rise we’ve already had in the last century. Just a little bit more sea level rise could really change the dynamic of what happens in the state’s coastal communities.”
Drilling Down into the Coastal Science
There’s one spot on Dan Hoover’s survey that can get tricky. It’s down at the south end where Ocean Beach narrows. In the lingo of coastal geomorphology, Hoover calls it the “pinch point,” a stretch of beach adjacent to shoreline that sticks out, or is “proud,” which makes it more vulnerable to erosion. “Sometimes things conspire against me and I have to get off the ATV and put the GPS in a backpack to finish the survey. That’s a lot of walking,” he says.
And a lot of walking is how scientists used to do these surveys, especially before they had GPS and all-terrain vehicles. Using strings, sticks and transects (manual surveying techniques) Hoover’s predecessors “took forever” to get 5-10 data points, he says, whereas now he’s getting thousands per hour. In recent years, remote sensing from satellites is adding millions of data points to ground-based coastal surveys.

GPS unit mounted on Hoover’s all-terrain vehicle. Photo: Katie Rodriguez.
“There’s a lot of variability and local effects across the state we don’t have the capacity to measure with our surveys,” says Barnard. Indeed, surveys by the USGS and Scripps Institution of Oceanography down south only provide ground data for about 3-5% of California’s beaches (unfortunately for climate adaptation efforts, federal budgets for coastal science continue to shrink).
“Surveys are good high-level measurements of what’s happening at a handful of beaches but now with satellites we can tell the whole story. They basically cover the world, everywhere, every day. Landsat and Sentinel now send back spatially extensive fine resolution data we’re able to mine pretty efficiently,” says Barnard.
The macro-level view from satellites complements the “in-situ” data collection USGS does on the ground — the micro level changes in beach elevation Hoover is feeling as he bounces around the beach on his ATV, as well as mid-level views of the coast coming from drones and plane cameras and LIDAR technology (ping ponging lasers off the land or water surface to get elevations). Research teams can also plug historic records of tides, storms, floods, currents and other events into the newer, more powerful, predictive models they’re developing.
“Before, all we had was a few surveys in a few areas that served as a general proxy for beach response,” says Barnard. But now, with access to exponentially more data from satellites, USGS feels it can produce much more accurate models and predictions of coastal change.
A suite of new research papers on USGS’s last decade of coastal studies, including Hoover’s local results, is expected out in the summer of 2024 or early 2025.

The percentage of beach loss across California as a function of time and projected sea level rise of three feet by 2100. Source: Vitousek, USGS.
One new national finding of interest, however, is that more severe scenarios of 10 feet of sea level rise by 2100 are implausible (based on an increased understanding of how ice sheets melt). “There’s more confidence the California Coast is going to get about another 10 inches of sea level rise by 2050, and less than six feet by 2100,” says Barnard. Needless to say, anything in the range of three to six feet would be catastrophic for most beaches and waterfront communities in California, as confirmed by recent satellite-based modeling.
Beach Laboratory
At five miles long and 750-feet at its widest, Ocean Beach is a great natural laboratory for studying beach behavior and change. There is so much going on in this one piece of coast: strong currents, strong wave and tide action, sand sloshing back and forth, seasonal change. Not to mention close proximity to 800,000 San Franciscans.
“There’s always the dogs and the kids and the people on the beach when I’m doing my survey,” says Hoover, but he doesn’t have time to watch the surfers or enjoy the scenery. “Since I don’t want to create any kind of situation out there, I’m really just focusing on what’s right in front of me — period.”
What’s right in front of him is one of the biggest natural beaches on the West Coast. San Franciscans may remember that six miles of sand dunes once covered the entirety of Golden Gate Park, and the Sunset and Richmond Districts. That’s where the famous local music festival Outside Lands drew its name from. In the 1800s, that’s what locals called the wilderness of sand on the city’s western flank.
 and a combined sewer-stormwater outfall mid beach. Photo: Katie Rodriguez.")
Eroding edge of Ocean Beach, with a combined sewer-stormwater outfall mid beach. Photo: Katie Rodriguez.
One of the things scientists are concerned with when it comes to sustaining beaches is their sand supply. Florida beach managers bring in mountains of white sand each year to plump up their beaches, especially after hurricanes carry it all away. But Ocean Beach has a built-in sand supply just outside the Golden Gate. For it is here that two long rivers, the Sacramento and San Joaquin, which drain a land area equivalent to 40% of the state, dump whatever sand and sediment they’ve picked up as they flow out to sea.
While it’s not as much as it used to be, with dams and diversions up and down the watershed, and with Gold Rush sediment mostly washed out of the system, there’s still a massive sandbar about five miles out from the red bridge. With the sudden constriction of the headlands, tidal currents under the bridge form a firehose of water and suspended sand pointing offshore. As the jet leaves the narrows of the Golden Gate it slows and spreads, and heavier materials drop out, creating the bar. Regular dumping of dredged material from Bay Area shipping channels also replenishes the bar supply. Then longshore drift, a coastal current, or waves deflecting off the bar, offer a natural delivery service to the beach.
But of course, the science shows it’s not quite as straightforward as that. The unique shape of the seafloor offshore affects how waves approach the coast and the resulting currents.

Bathymetry of the sand bar and Continental Shelf outside the Golden Gate. Source: USGS.
History played a role too. All the filling of the Bay and development in the watershed changed the tidal prism, weakening the firehose effect, and changing the shape of the sandbar, which Hoover describes as a “half bagel.” Recent research suggests that over the last 150 years, the bar has been contracting back toward the mouth of the Bay and that in the last 50 years the bar has been shrinking (by the equivalent of 10 million dump trucks worth of sand so far). This may not be a good thing.
“You need some upstream sand to keep supplying the downstream losses,” says Hoover.
The other thing that makes Ocean Beach a good laboratory for research is that it is always changing: growing at the north end and shrinking at the south end. Over 20 years, USGS data show the face of Ocean Beach is now angling slightly from its earlier north-south orientation. “It’s building out up at the north end by the Cliff House, like moving from 12 noon to 11:50, but going the other way down at the south end. That’s not good for the wastewater treatment plant because they’re right there,” says Hoover.
Two years ago, the city built a temporary wall of sand on Ocean Beach to protect its sewage plant and facilities. Now most of the sand is gone from the shore but still underwater, where the new shallows and mounds help break up waves and prevent erosion. Hoover’s seen this particular sand on his jet ski surveys.
Surveying underwater sand deposits and topography on jet skis in Santa Barbara County. Source: Peter Pearsall, USGS.
Rip rap and seawalls are less adaptable. “When you armor the coast, it stops the erosion,” he says. “But it also tends to create conditions that are counter to beach stability, because you have waves attacking this pile of rocks and all this turbulence, so sand doesn’t want to settle there.”
And coastal managers want the sand to settle. Once you start confronting climate adaptation options for eroding coasts, the sand supply for buffering beaches and the sediment supply for mudflats and wetlands that can also soak up sea level rise, become critical. Coastal planners want to know if they can rely on these supplies or not, and for how long, and also more precisely how their particular coasts will respond to rising sea levels and changing wave conditions.
USGS is trying to provide answers. Planners and the public, in the meantime, seem to favor working with coastal processes, namely nature-based adaptation and living coasts, over rigid protective infrastructure. But sometimes there are only two uncomfortable options: retreat, or build a seawall.
Big Infrastructure in the Wrong Place
Just inland of the south end of Ocean Beach stands a cluster of essential public facilities that collect and treat both wastewater and stormwater and serve more than 250,000 San Franciscans. Those facilities include a treatment plant, a pump station, a recycled water facility, and a pipeline that discharges clean or treated water to the ocean. Along the shore, and critical within this network, lies the Lake Merced Tunnel which moves waste and stormwater from drains at the bottom of Sloat Avenue to the treatment plant.

Westside Pump Station at Ocean Beach, including sand being stockpiled for erosion protection. Photo: Katie Rodriquez.
All that stands between these facilities and the advancing Pacific is the Great Highway and a narrow strip of Ocean Beach. After declaring three emergencies in the late 1990s and early 2000s, where the city had to get after-the-fact permission from the California Coastal Commission to place temporary rock or sandbags on the public coast, something had to be done. The turning point was the multi-party Ocean Beach Master Plan, completed in 2012, one of the first times San Francisco planning documents clearly included terms like “managed retreat” and “climate adaptation.”
Today, a decade later, the SF Public Utilities Commission (SFPUC) is taking the city lead for one portion of the master plan: the removal of a section of the Great Highway, the construction of a buried seawall, and the creation of various new coastal amenities.
“The wall will be built in front of the Lake Merced Tunnel and below grade, so you won’t see it most of the time. On top we plan to recontour the current, rather vertical bluffs, with a gentler laid back slope down to the beach,” says Anna M. Roche, SFPUC’s project manager.

Cross-section of plans to protect the Lake Merced Tunnel and improve public access. Source: SFPUC.
This particular seawall is being built in a spot now occupied by another valuable public asset. “We’re using a technique called managed retreat, we’re giving up some city infrastructure, a piece of the Great Highway, to protect both coastal access and our facilities,” says Roche.
Before settling on this rather complicated intervention, first floated in the Ocean Beach Master Plan, the SFPUC considered a variety of other alternatives, including moving the Lake Merced Tunnel out of the way entirely. But the way Roche describes it, behind the tunnel is another piece of wastewater infrastructure, and behind that another and another, and behind all that is the treatment plant.
“The facility is relatively new, so it was not cost-beneficial to just walk away from it,” she says. “This alternative is a compromise. It meets a lot of objectives in a very crammed, small space.” The project will not only protect critical infrastructure but also create safe public access to this stretch of coast and address future flood risk from sea level rise.
One construction challenge is that the area is in an active wave zone. Crews will likely build cofferdams, drying out segments to work on, then moving onto the next. Another challenge will be to keep soil and sand now on top of the tunnel, and holding it down, in place. “If the material moves, the tunnel could become buoyant, lift, and crack, spilling sewage onto the beach. That’s what we want to prevent,” says Roche.

Components of the adaptation plan for the SFPUC facilities on Ocean Beach. Map: SFPUC.
But the engineering has been easy compared to the coordination required to make all the moving parts of this climate adaptation project controlled by the city align. “We’re not used to doing projects where multiple city agencies have decision-making and funding responsibilities, we’re used to working agency by agency,” says Roche, adding it isn’t always clear who gets to make the final decisions.
One bright spot was the establishment of a regular meeting among city departments to talk about climate work in 2019. “It’s been a painful growing experience, but the process is getting better,” she adds.
As 2024 kicks off, SFPUC has made it through 95% of the design and most of the environmental impact review hoops necessary to carry out their piece of the master plan. They’re now busy getting legislation through the board of supervisors allowing closure of a piece of the Great Highway and finishing a coastal development permit. Construction is likely to start in late 2024.
And while the long-term sustainable solution gathers momentum, short term band-aids like stockpiling and deploying one-ton sandbags are still required, especially now with El Niño and such unusually high surf this winter.
The challenges of San Francisco’s project offer more than a glimpse of the hard decisions ahead for coastal cities with critical public utilities in the path of rising sea levels, stronger waves, and more intense runoff. One thing is for sure: As flooding rapidly becomes more frequent, extensive and catastrophic, cities are beginning to feel the compounding effects. And impacts on essential services located in the coastal or shore zone will be felt not just on site, but also by the hundreds of thousands of people who rely on them.
A Surf Town with Steep Watersheds
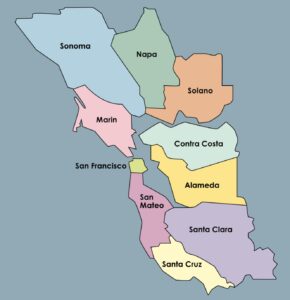
Last year’s storms didn’t affect San Francisco as much as they did Santa Cruz, a small surfing town about 90 minutes south and around a continental corner. The headlands there shelter much of the county’s waterfront, which faces south rather than due west, like Ocean Beach, and thus takes Pacific waves more obliquely. Another factor that makes Santa Cruz’s experience of coastal erosion and storm extremes a bit different from San Francisco proper is the river that runs through it. Not to mention the dozens of other short steep watersheds where a spot of bad weather can change everything, everywhere, all at once. In a giant wide shallow watershed like the San Francisco Estuary the response is more muted.
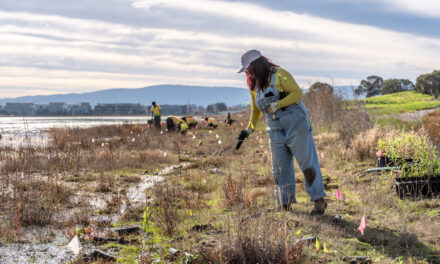
“Whatever is happening in a watershed here — like landslides and heavy rain — we’re going to feel it quickly and directly on the coast, often within hours,” says USGS geologist Amy East. East has been studying the 138-square-mile San Lorenzo River watershed that drains through the heart of downtown Santa Cruz. The watershed is relatively rural, with no major dams and little armoring except through the neighborhoods at the coast.
San Lorenzo River flooding in Santa Cruz on January 9, 2023 after a series of atmospheric river storms. Video: Virtual Planet Technologies, Dr. Juliano Calil
With rain, the San Lorenzo delivers sediment of all grain sizes to the beach flats at the river mouth. East has been studying how much, and where it goes, and how big the grain sizes are of the material moving downstream.
As the stormy season got underway with the New Year, East’s team was already out dropping sampling bottles down riverbanks and off bridge railings. Samples are analyzed for how much sediment is suspended in the water, by volume, and for grain sizes.
“We’re out at all hours, 24/7, in very high flow conditions, which can get a little exciting,” says East. Her crew always wear life jackets when they’re working around the thundering river. But after midnight, or at other edgy times, the Santa Cruz Police department keeps an eye on them, she says, gratefully.

USGS scientist Andy Ritchie collects samples of water and sediment from the San Lorenzo River during a 2023 flood. Photo: USGS.
While the data being collected this year is still in progress, an earlier 2018 paper compares sediment delivery to the coast from the San Lorenzo watershed in drought years and wet years and more recently extremely wet years like the winter of 2016-2017. That winter season was unusual not because of any one outsized storm but because of multiple, closely spaced atmospheric river storms. In the San Lorenzo watershed, stream gauges clocked nine floods in one season (each of which would have historically only occurred once every 2-10 years).
As East’s team continued their sampling through the storms of early 2017, they noticed the flood flows supplied a higher proportion of sand to the coast. As the rainy months go by, East explains, the soils become more saturated, and there are more landslides in the watershed, releasing coarser grains overall than the earlier floods of the season. East’s team also surveyed the subsequent nearshore beach topography at the mouth of the river. “In the very wet years, we found the later floods are more likely to build beaches and have effects on the shape of the coastline, at least for timescales of years,” she says.
During the 2017 very wet winter, for example, river flooding delivered an estimated 300,000 tons of new sediment to the beach flats, creating an 11-foot-thick deposit that extended more than 500 yards offshore, according to her data. After a very wet year like 2017, sediment loads were 10 times greater than those of average years. In addition, the sand was of such coarse grain size and large quantity that it was likely to stick around, she says.
 October 2014 and March 2015, during severe drought; (B) September 2015 and March 2016, during an average-rainfall year with substantial wave energy during a strong El Niño event; (C) September 2016 and March 2017, a record-wet winter. Chart: East., USGS.")
Results of repeated surveys of coastal bathymetry and topography showing geomorphic change over three winters, between: (A) October 2014 and March 2015, during severe drought; (B) September 2015 and March 2016, during an average-rainfall year with substantial wave energy during a strong El Niño event; (C) September 2016 and March 2017, a record-wet winter. Chart: East., USGS.
Knowing this is important as Californians try to manage the effects of our new climate, which whiplashes between drought and deluge. If it stays dry for a prolonged period, watersheds deliver very little sediment to coastal flats and habitats, whereas even one extreme wet year can deliver boatloads. This could be advantageous for beach management strategies, as beaches remain hemmed in by urban development and unable to migrate naturally inland. “Maybe these very wet years can somewhat locally counteract the beach loss that we expect from sea level rise, but we don’t know enough to quantify that yet,” says East.
Facing the Public with the Bad News
Santa Cruz County is no stranger to broken piers, flooded restaurants, and collapsing cliffs due to its long boundary with the Pacific. As such, the City of Santa Cruz has been troubleshooting vulnerabilities and adaptation planning for at least 15 years.
To engage their diverse residents and tourists in developing a stronger vision of coastal management in the context of climate change, Santa Cruz has conducted surveys, held trust-building meetings, prepared newsletters and videos, and invested in visuals and multilingual communication. Their early public-facing web pages on coastal adaptation challenges in seven places along the Santa Cruz coast are full of easy-to-understand story maps, logical timelines, and inviting colors.
Coastal scenes from Santa Cruz. Video: Virtual Planet Technologies, Dr. Juliano Calil.
The city has also collaborated with everyone from USGS scientists to California State Parks to nonprofits more apt to reach neighborhood residents, like a local watershed council that hired a pair of artists to do flood murals on storm drains this year.
Two big ongoing projects are the city’s overall Resilient Coast Santa Cruz Initiative and the West Cliff Drive 50-Year Vision process, a long term look at the options available for managing the erosion-prone clifftop roadway and coastal path. The city is also working to install new infrastructure around the river mouth to minimize neighborhood flooding, build emergency infill walls to shore up areas damaged during the 2022-2023 storms, and update their local coastal program (LCP) to consider sea level rise, among other projects.
Much of this effort folds into what Santa Cruz Sustainability and Resilience Officer Tiffany Wise-West calls adaptation “pathways.”
“Managing the coast in the context of climate change, and such deep uncertainty, has to be iterative. We need to be continuously refining our knowledge base, taking the pulse of our communities, monitoring coastal conditions, and pushing regulators to respond,” says Wise-West.

Online tracking of adaptation pathways. Image: Resilient Santa Cruz Initiative.
Last year’s storms “created a sense of urgency and a whole-of-government approach that was previously missing,” says Wise-West, echoing frustrations about coordination hurdles aired by SFPUC’s Roche.
Though it’s been difficult to reach community consensus on a 50-year vision, the pathway approach of milestones based on “if this, then that,” is a start. For now, it also helps bring near-term goals into focus. Everyone does seem to agree, for example, that “nature-based” interventions like a living shoreline around the river mouth, should be a priority, if feasible.
For common folk, meanwhile, the small things we can do give us agency. Like stopping by one of the “CoastSnap” stations Wise-West is trying to set up along clifftop trails and beachfront roads so residents and tourists can help monitor their evolving coastline. Passers-by put their smart-phone in a station cradle, take a photo, and then upload the image with a GPS location, date and time to the city’s monitoring website. “It’s an open-source way to do community science,” says Wise-West.
CoastSnap will be paired with a new tide gauge and cameras positioned on beaches and bluffs in an amped up coastal monitoring network Wise-West has planned with 12 other federal, state and local partners. “In order to operationalize adaptation pathways you need to be able to monitor coastal change,” she says.
Eye on the Horizon
When my father died of COVID at the dawn of the pandemic, like so many of our fathers, my first instinct, that day when I got the call, was to go to the beach. It was Dec. 21, 2020 — the winter solstice. I gathered my daughters and my husband and in 20 minutes we were at Ocean Beach facing the Pacific.
I’ve never thought it was a particularly beautiful beach, so cold and foggy so much of the time, its seawalls inked with graffiti. Nor had I spent much time there since the 1990s, when I walked our regional coasts to write a guidebook for the Golden Gate National Recreation Area. I can only say that the sight of the ocean, the connection to the infinite and the unknown it provides, did for me what it does for so many. I could imagine anything I liked in that scene; the many times I searched for jade and carnelian pebbles with my father; the way he so deeply honored nature and taught me the same. The place, somewhere out there in the mists and deep waters, he might have gone.

Photo: Katie Rodriguez.
Our coast is deeply lodged in our hearts as Californians. The beach is a favored place to connect with it.
Maybe the coast, so naturally changeable, has a thing or two to teach us about adapting to future uncertainties. It’s a place where if we watch a grain of sand travel, or trace a contour, we can learn new things, and be renewed.
As Dan Hoover, the USGS surveyor, put it: “We all like to go to the beach. It’s good for our souls.”
![]() Find out what happened next.
Find out what happened next.
The story has a follow up!
How Two Rivers Could Save Sinking Beaches & Marshes, Sept 2026
EXTREMES-IN-3D
SERIES CREDITS
Managing Editor: Ariel Rubissow Okamoto
Web Story Design: Vanessa Lee, Tony Hale, Afsoon Razavi
Science advisors: Alexander Gershunov, Patrick Barnard, Richelle Tanner
Series supported by the CO2 Foundation.
Reporting supported by Pulitzer Center, Connected Coastlines.
Special thanks for Beach Losses Loom
Banner video: Aerial video of the central California coast including Big Sur, Capitola, Santa Cruz, and San Francisco Bay by Peter Pearsall, USGS.
Graphics Support: Darren Campeau
Special thanks to Dan Hoover at USGS for science graphics support.