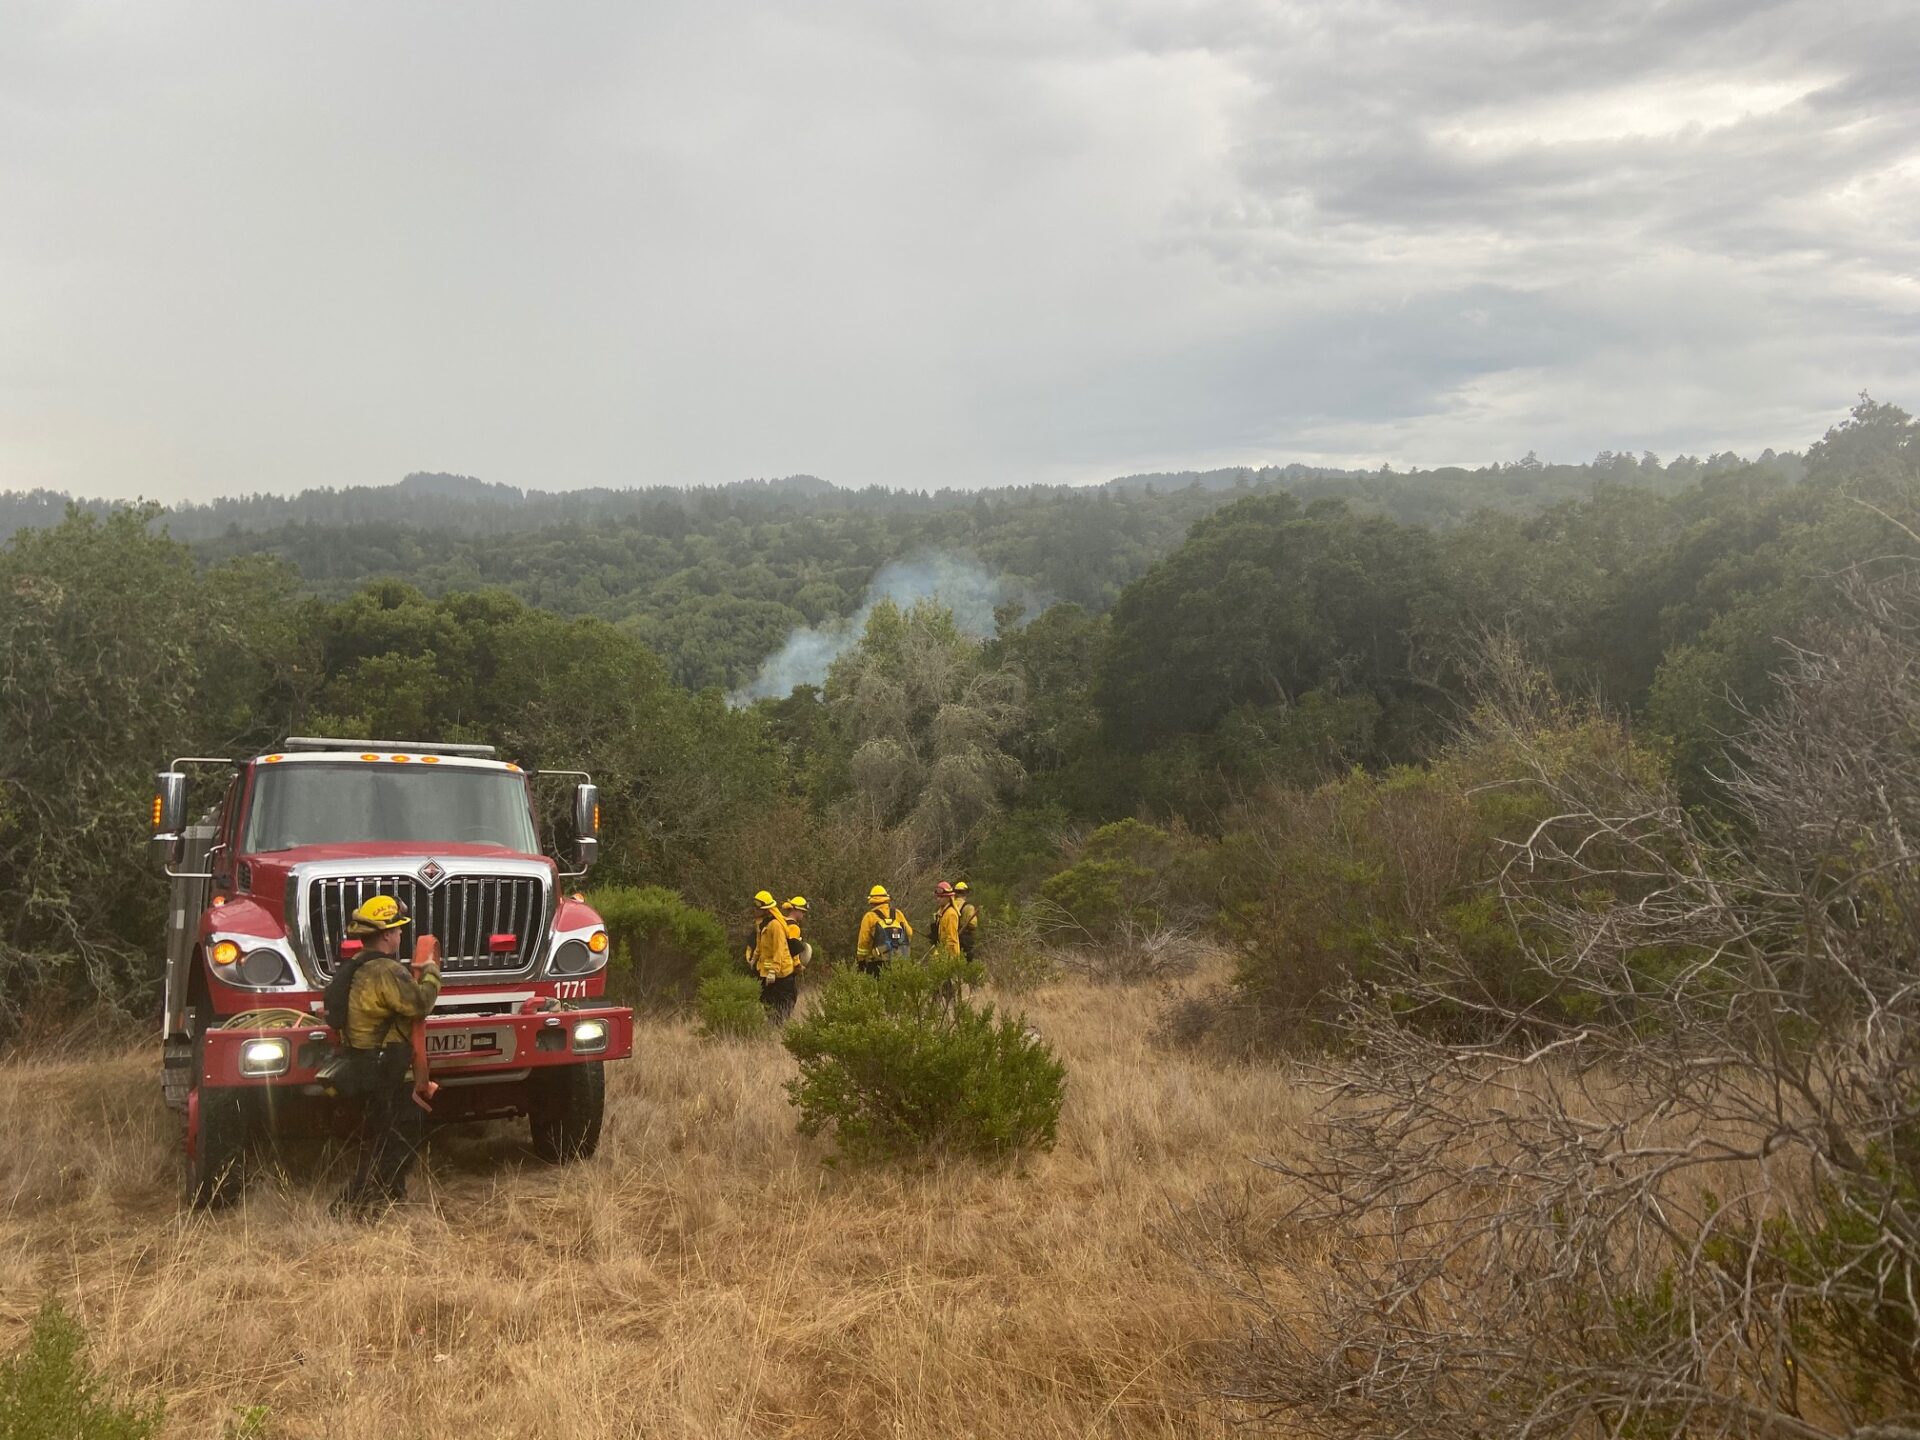
Chasing the Fireline
In a changing world, maps become outdated. Those depicting the Aral Sea as a vast blue ink stain in central Asia are years behind the curve, for much of the giant lake has been depleted by agricultural diversions and desertification. Many maps where lush equatorial green represents tropical rainforest fail to reflect deforestation.
In California, climate change has pushed another sort of map toward obsolescence. Prolonged droughts and increasingly severe heat waves have amplified the state’s wildfire season, rendering a collection of wildfire hazard zone maps, published 15 years ago by state fire officials and used to guide development and planning processes, out of date.
Jim McDougald, staff chief for the California Department of Forestry and Fire Protection (Cal Fire)’s community wildfire preparedness and mitigation program, says that wind-driven wildfires in fall and winter have seen an uptick in the past five to ten years, especially in Napa and Sonoma counties.
Now, Cal Fire is making changes to the agency’s Fire Hazard Severity Zone maps to more accurately portray the most flammable regions of the state.
“The new maps will be a lot more accurate to the weather that we’re now experiencing in California,” McDougald says.
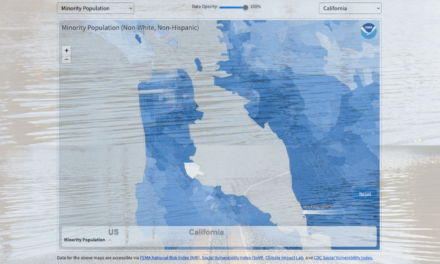
The maps, viewable online and last updated in 2007, use color coding to delineate regions at high resolution based on fire hazard level. Revisions, McDougald says, are being submitted to local Cal Fire units for review and necessary tweaking this summer. This fall, the agency will present its final maps.
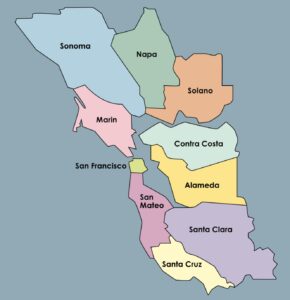
According to the 2007 maps, one of the most fire-prone areas in the Bay Area is the East Bay hills, where a north-south swath of bright red and salmon pink — color code for “very high” hazard in, respectively, locally managed areas and lands managed by Cal Fire — runs from Hayward to north Richmond. Berkeley, El Cerrito, Piedmont, and Oakland each contain high-danger zones. On the San Francisco peninsula, a similar hazard band runs from Woodside almost to Burlingame, spilling westward over the ridge and down to the San Mateo coast. San Bruno Mountain is charted as a moderate hazard area, while vast swaths of the North Bay, from Santa Rosa to Lake Berryessa and northward through Lake and Mendocino counties, are rated as very high. Western Sonoma County is a notch lower.
Other Recent Posts
Wild Pigs Rough Up Bay Area Greens
They tear up landscapes in search of food, prey on native wildlife, and damage streams, and warming could bring them closer to urban areas.
Delta Residents Absorb the Flood Challenge, And Choose Different Ways to Act
Graduates of a shoreline leadership program in Contra Costa County recently pitched their ideas for sea level rise education and adaptation.
Strong Leader, Light Touch: Caitlin Sweeney
Ahead of her retirement earlier this month, the Estuary Partnership director sat down with KneeDeep to discuss her achievements and the future of the Bay.
Unmasking Regionalism
Regional leaders say the Bay Area has built ambitious climate resilience plans. Now comes the harder task: funding and implementing them.
Pacheco Pass Is Getting a Second Wind
In Pacheco Pass, a decades-old wind farm is getting an upgrade that will double CleanPowerSF’s wind energy.
Climate Change, A Scorpion’s POV
From the Sierra Nevada to the Mojave Desert, the state’s native scorpions are losing habitat as heat, wildfires, and development reshape ecosystems.
12 Creek Types: Which One Is In Your Backyard?
Geomorphologist Gregory Pasternack and his team documented 12 types of Bay Area creeks to help residents protect themselves from flood threats.
Could Avocados Be A Transformational Fruit for the Bay Region?
Local growers and activists are planting avocado trees to build climate resilience, local food systems, and alternatives to imported fruit.
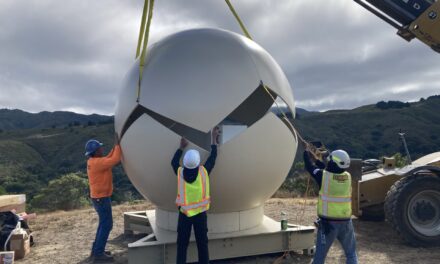
Radar Gap Filled on Marin Mountaintop
A new weather radar installation will help the region’s northern counties read incoming storm clouds, hours before they drop their rain.
The Climate Questions Facing Bay Area Voters This Spring
Important details about votes on transit funding, open space preservation, wildfire prevention, and earthquake prep this Election Day.

Fire hazard severity zone map from 2007. Officials point out that “hazard” is not the same thing as “risk,” which is associated more with human behavior (the material a home is built of, how close a structure is to the edge of a forest, etc). Hazard encapsulates greater environmental aspects, like the forest itself and elements of climate, such as the notoriously fire-friendly Santa Ana and Diablo winds.
Exactly why late-fall and winter wildfires are becoming more severe is explained by several factors, says Sasha Gershunov, a research meteorologist at the Scripps Institution of Oceanography. He says data on wind patterns do not indicate significant changes in strength, frequency or seasonality. Southern California’s Santa Ana winds and northern California’s Diablo winds typically occur in November and December, as they historically have, Gershunov notes.
However, the seasonal conditions that precede these westward wind events have become extremely erratic. Heatwaves have intensified, and variability in precipitation has increased.
“It’s gotten really wild, from super wet years to super dry years,” Gershunov says.
Increasingly, the first of the season’s rains arrive weeks later than the historical average. This, combined with high autumn temperatures, creates prime fire conditions exactly when warm winds are gusting across the Bay Area — November, December, and even January.
“The fuels are drier longer, into the peak of the wind season,” Gershunov says, adding that climate models suggest this delayed start to the wet season “will become a trend.”
In a combustible and changing landscape, the state’s fire hazard mapping program helps guide responsible development — ostensibly, at least — by accurately reflecting where wildfires are most and least likely to occur.
“Building standards are tied to these maps,” McDougald explains. “And there are defensible space requirements tied to the fire hazard severity zones.”
While state law requires that officials update the maps periodically, it doesn’t specify how frequently updates must be made. Instead, it leaves that decision to the judgment of state fire officials. With the effects of climate change on California’s fire season becoming more noticeable each year, it’s only a matter of time before the next round of revisions are due.