
Change Detection Made Easier with New Lidar Survey
Small airplanes flew 368 trips back and forth around the edges of San Francisco Bay and the Delta last summer to capture what scientist Lisamarie Windham-Myers calls “the first seamless elevation map of the Estuary.”
On their flights, moving back and forth in linear swaths like a lawnmower, the planes sent laser beams down to the surface, which then bounced back to the plane. Each bounce yielded a measurement of surface elevation from a remote-sensing technology called lidar (short for light detection and ranging). The result, to be released this July, will be a high-resolution map of the entire estuary’s 1.25 million acres of wetlands, shores, islands, and levees.
“For years, every time anyone needed elevation data, they went out and collected it on their own, using their own equipment, their own standards, their own patch of geography,” says Megan Nguyen, who works with Windham-Myers at the Delta Stewardship Council. While that’s fine for work on single projects, the data sets are all different and form, at best, a patchwork quilt of information.
With rising sea levels and increasingly wet storms, and with hydroclimates changing faster than anyone expected, decisionmakers need to see a more complete picture of changes in the Estuary.
“We need to protect people’s homes and farms, as well as species habitats and urban infrastructure, and you can’t do that with a static map of flood risk,” says Windham-Myers.
The last times planes did lidar surveys on a larger landscape scale was in 2010 for the Bay and 2017 for the Delta, and the quality and scope weren’t perfect in either, says geospatial scientist Alex Braud with the SF Estuary Institute. But even those benchmarks make scientists eager to see the results of this much more high-quality survey so they can engage in an activity called “change detection.” Did the sloughs get bigger when a levee was breached? Did the levee repair after a recent earthquake hold? When developers constructed a dozen new homes next to the Dutch Slough restoration site, did any water or sediment shift into unanticipated places?
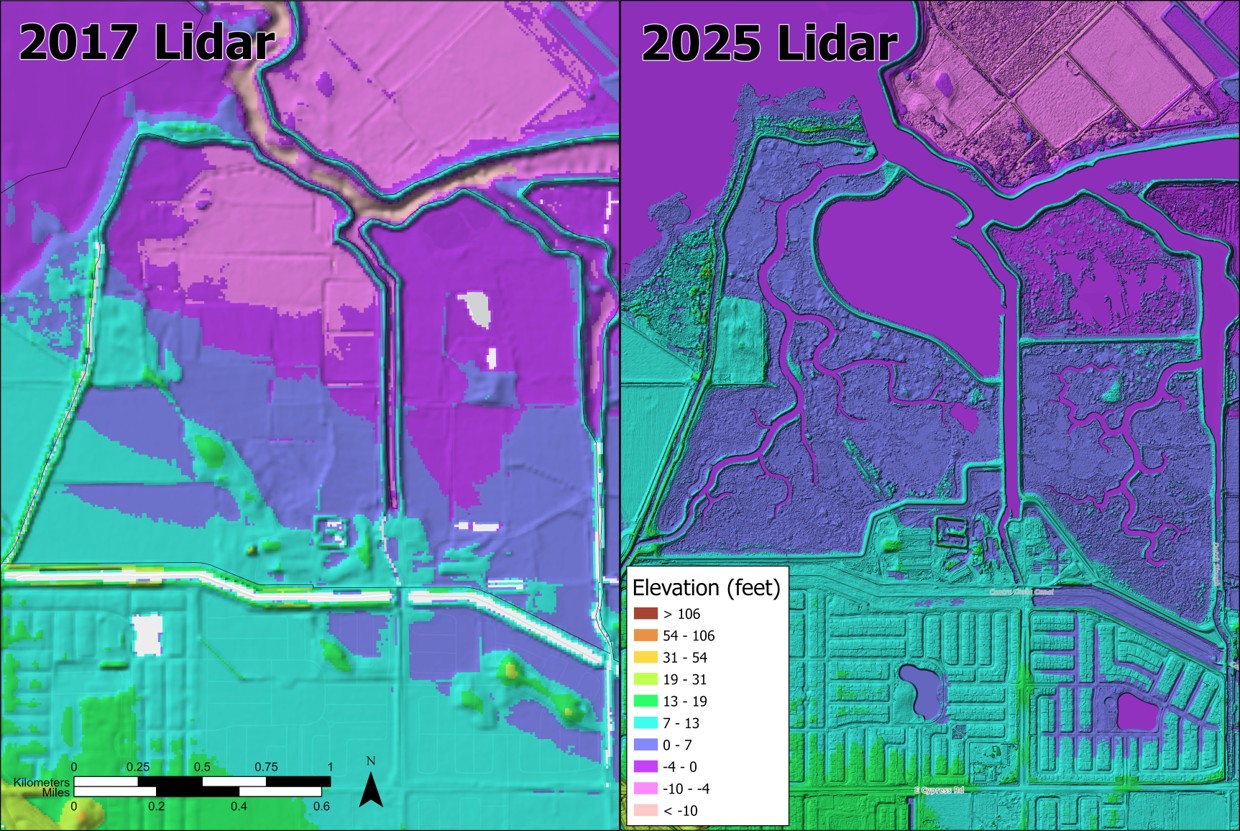
A draft estimate of change detected in tidal channel development around Dutch Slough before (2017) after restoration (2025). Image: DSC
What’s unusual this time around is how three partners went in on the project together so the mapping results could be standardized across the entire estuary, and so that no corner would be left unmapped.
While collaborating regionally is clearly more cost-effective, it takes work. In this case, the impetus came from the multi-agency Wetlands Regional Monitoring Program (run by SFEI and the SF Estuary Partnership), which wanted the lidar map for its update of the 2020 Baylands Habitat Map. They’d carved out $300,000 from some of their SF Bay Restoration Authority funding to do the flyovers, but SFEI wondered if there was a way to include the Delta for a more complete, whole estuary picture. One year and dozens of phone calls later, they got it: the Delta Stewardship Council and the California Department of Water Resources each contributed over $200,000, and others also chipped in, including the South Bay Salt Pond Restoration Project and Valley Water.
“Lisamarie and I were on speed dial for a month at one point trying to figure out how to make this happen,” says Braud.
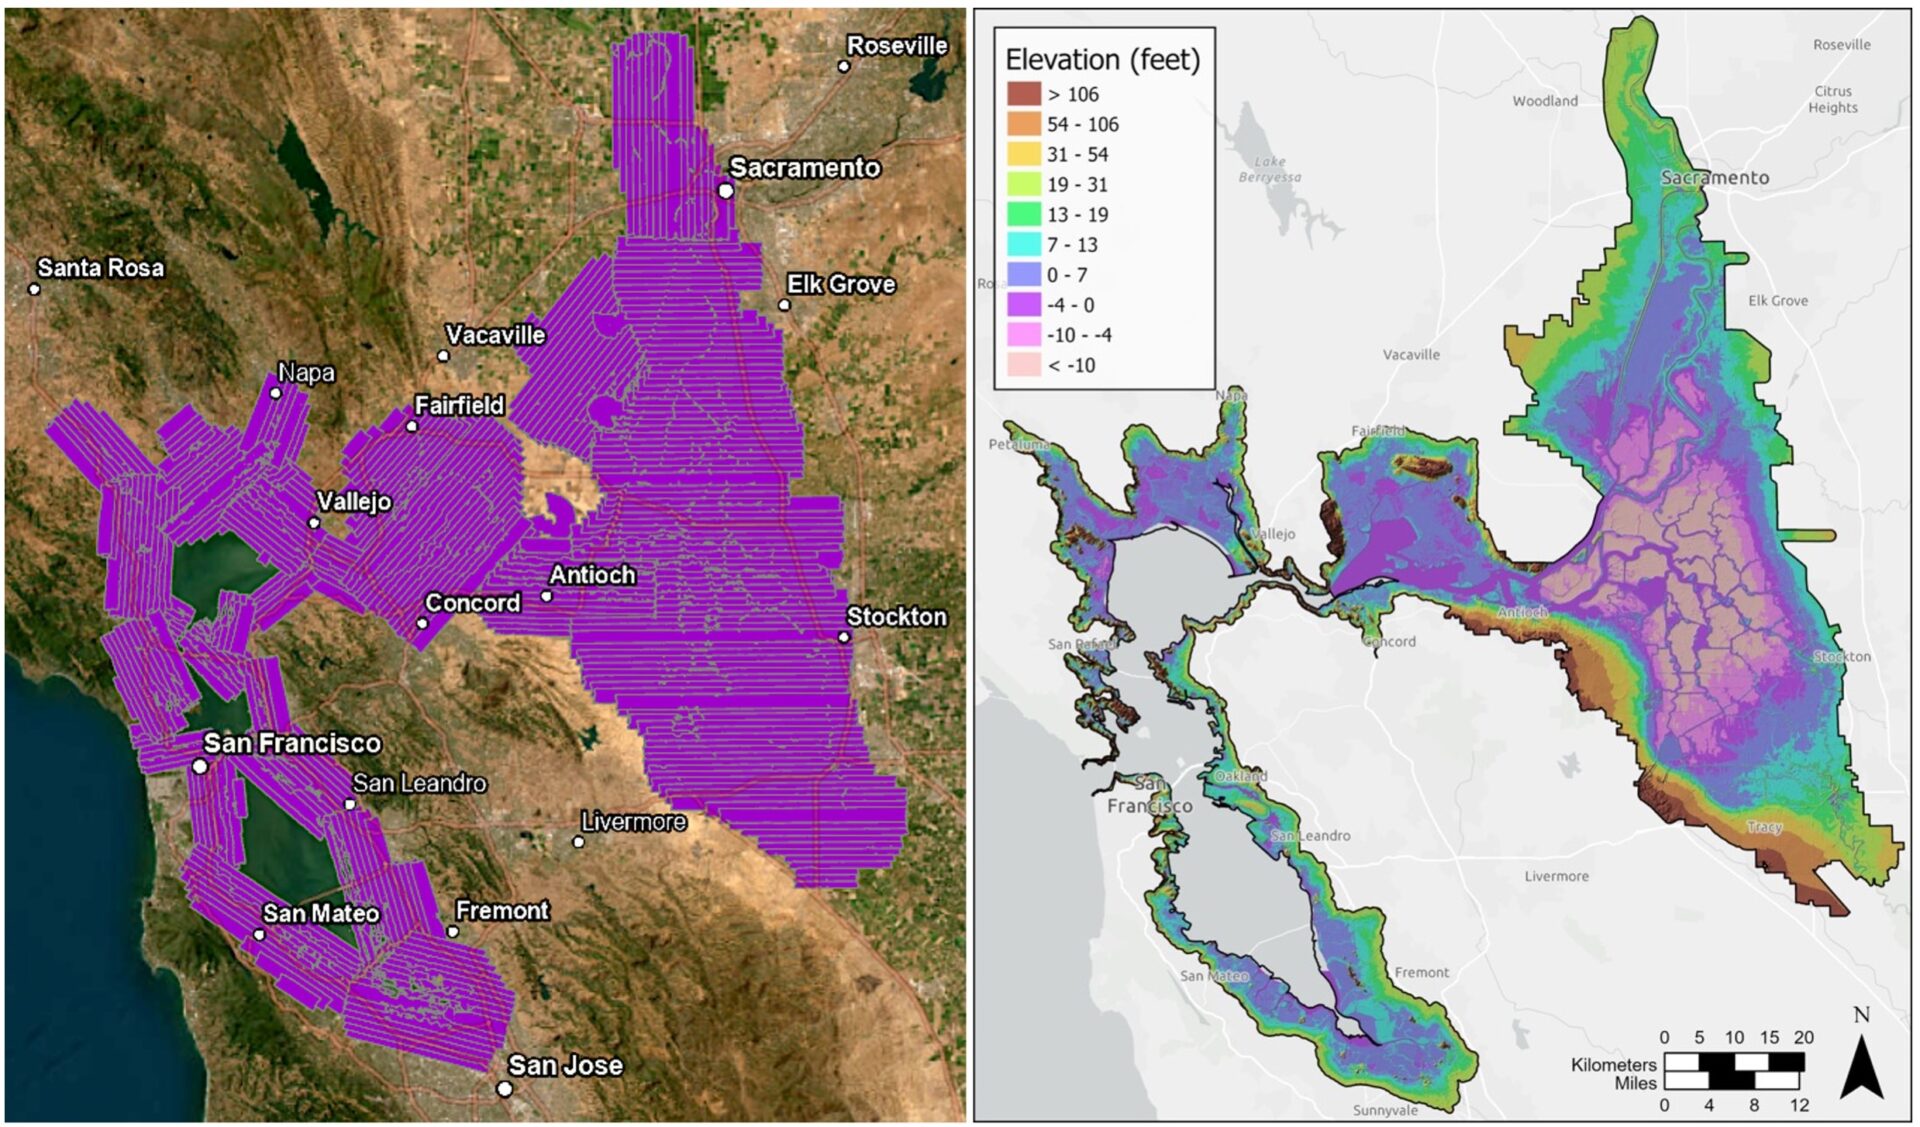
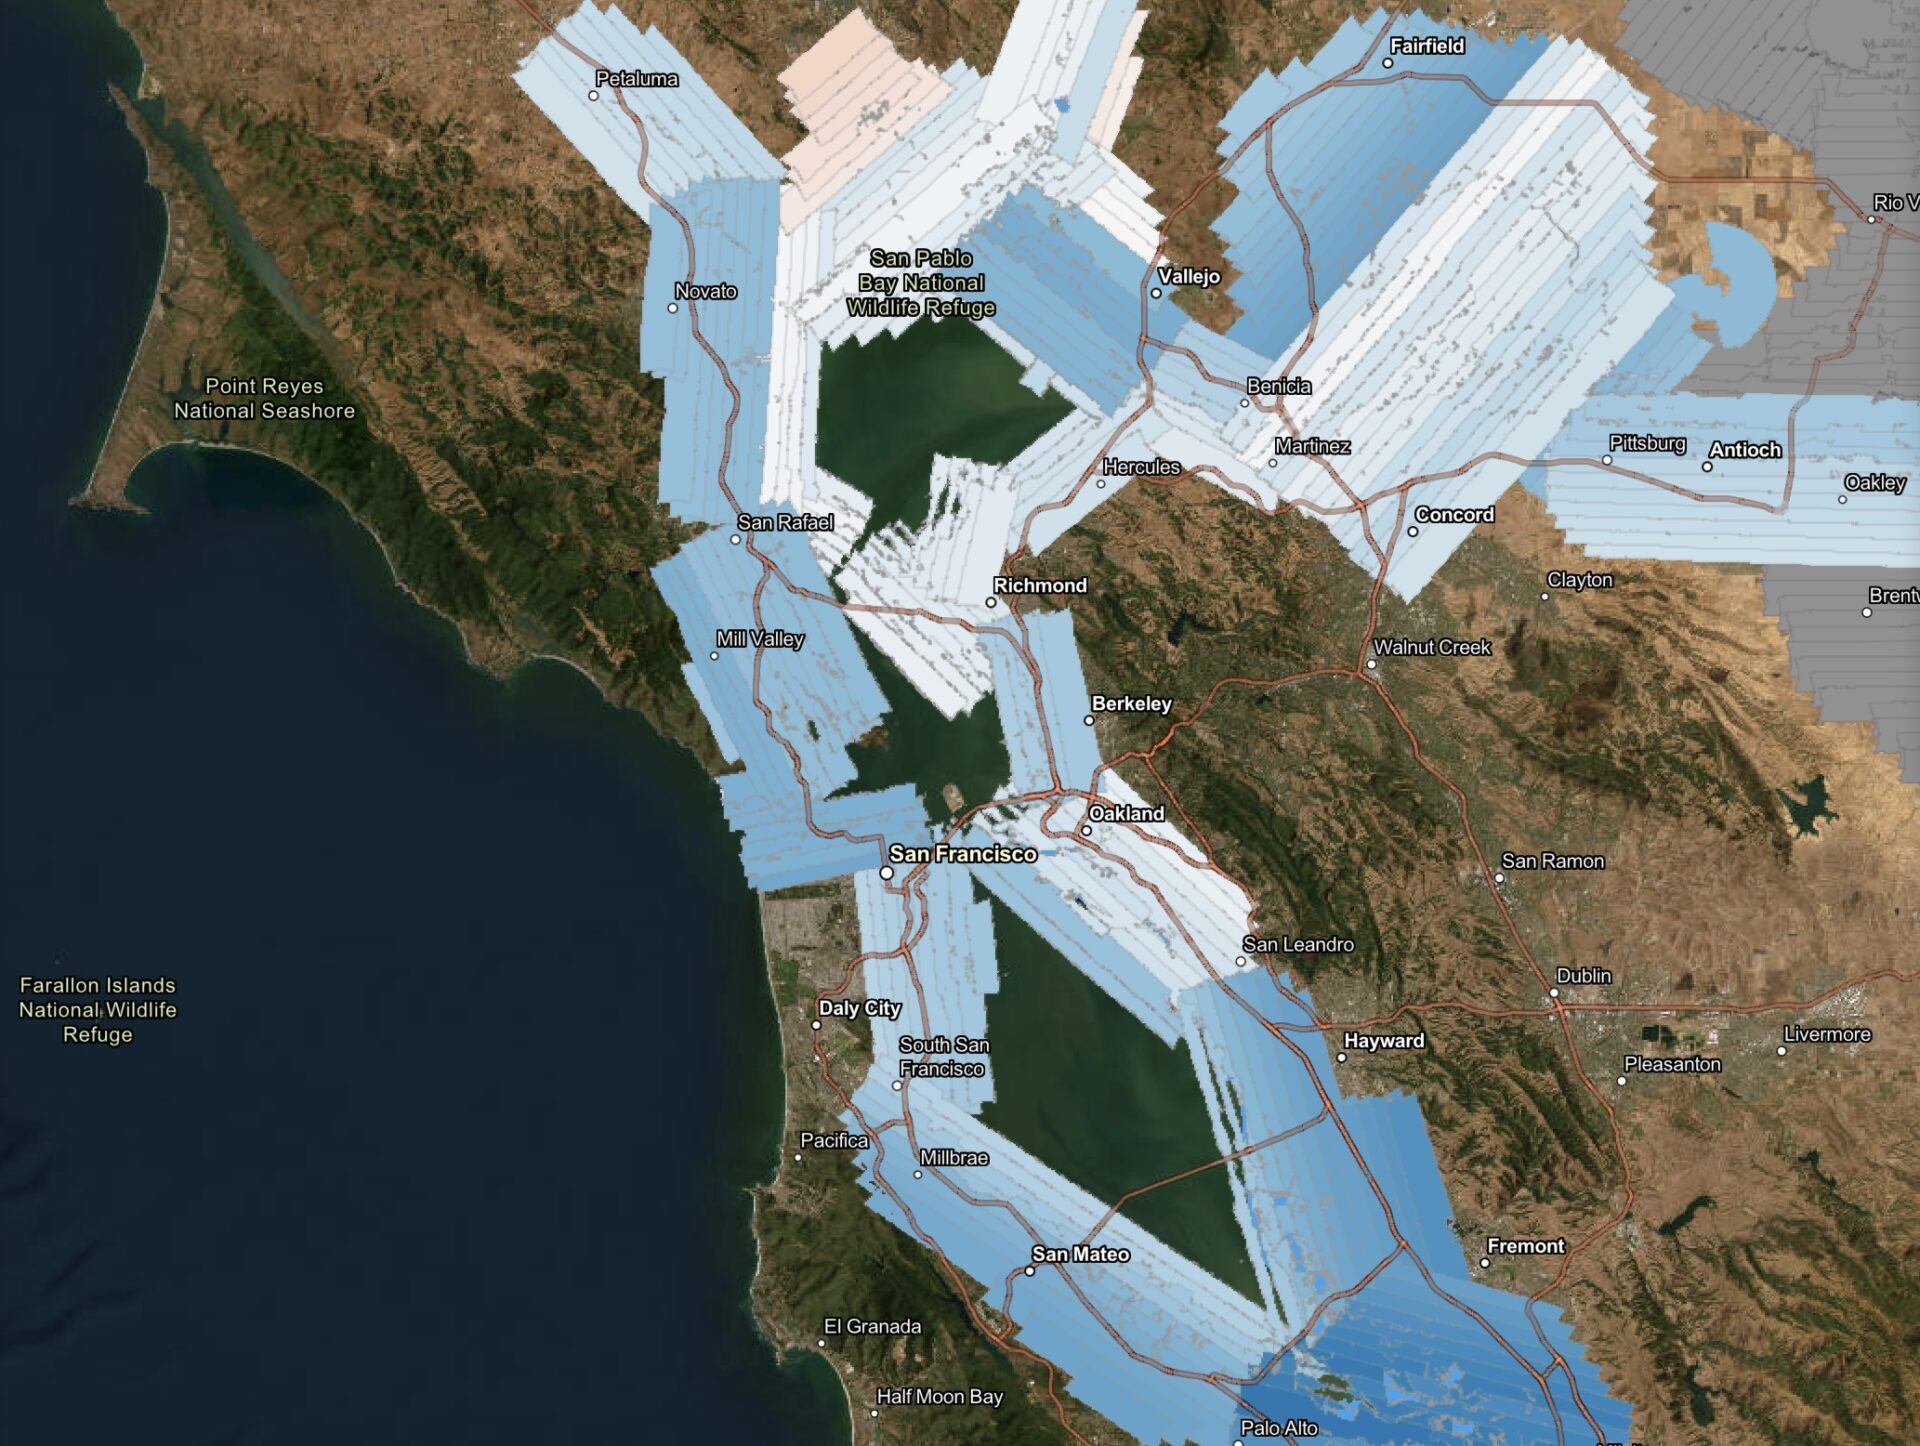
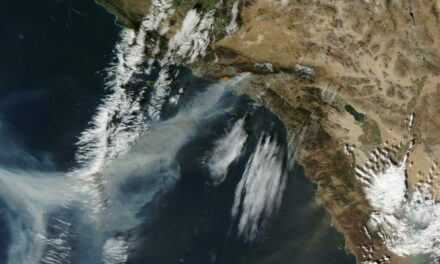
Map of approximated flight paths and preliminary results of 2025 lidar survey. Map: DSC
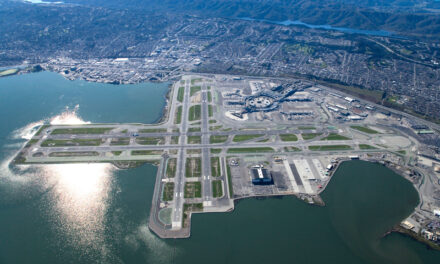
Apart from funding, other challenges the project encountered included often having to fly at 2 a.m. due to FAA regulations around airports on the bayshore (luckily, lidar works day or night). Around the Bay, survey planners also had to time flights at the lowest tides (below mean sea level) to capture as much of the underlying intertidal topography as possible. Most of the Delta flights weren’t timed to tides but were flown in the summer, when water levels throughout the system were low.
Another challenge was adjusting for beams that bounced off treetops or pickleweed beds instead of ground level. This higher resolution survey — yielding 12 data points per square meter versus three to eight points on prior surveys — will help scientists see everything on a finer scale. “If you have a lot of data points, one of them is going to get through to the ground and not bounce off a leaf,” says Windham-Myers. She adds that some of DSC’s engineers were delighted to see they could tell the difference between corn and orchards in the resulting maps.
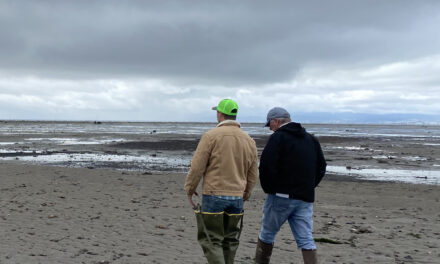
Marsh plants can be harder than row crops for lidar to penetrate, though. “There is so much dense vegetation in a marsh, capturing true ground is challenging,” says Braud. To overcome this, the WRMP is ground-truthing some areas by triangulating their position using a pole planted in the ground and GPS satellites. Braud has also been writing algorithms to mesh imagery and vegetation density data being collected or modelled by the WRMP with the new lidar elevation data.
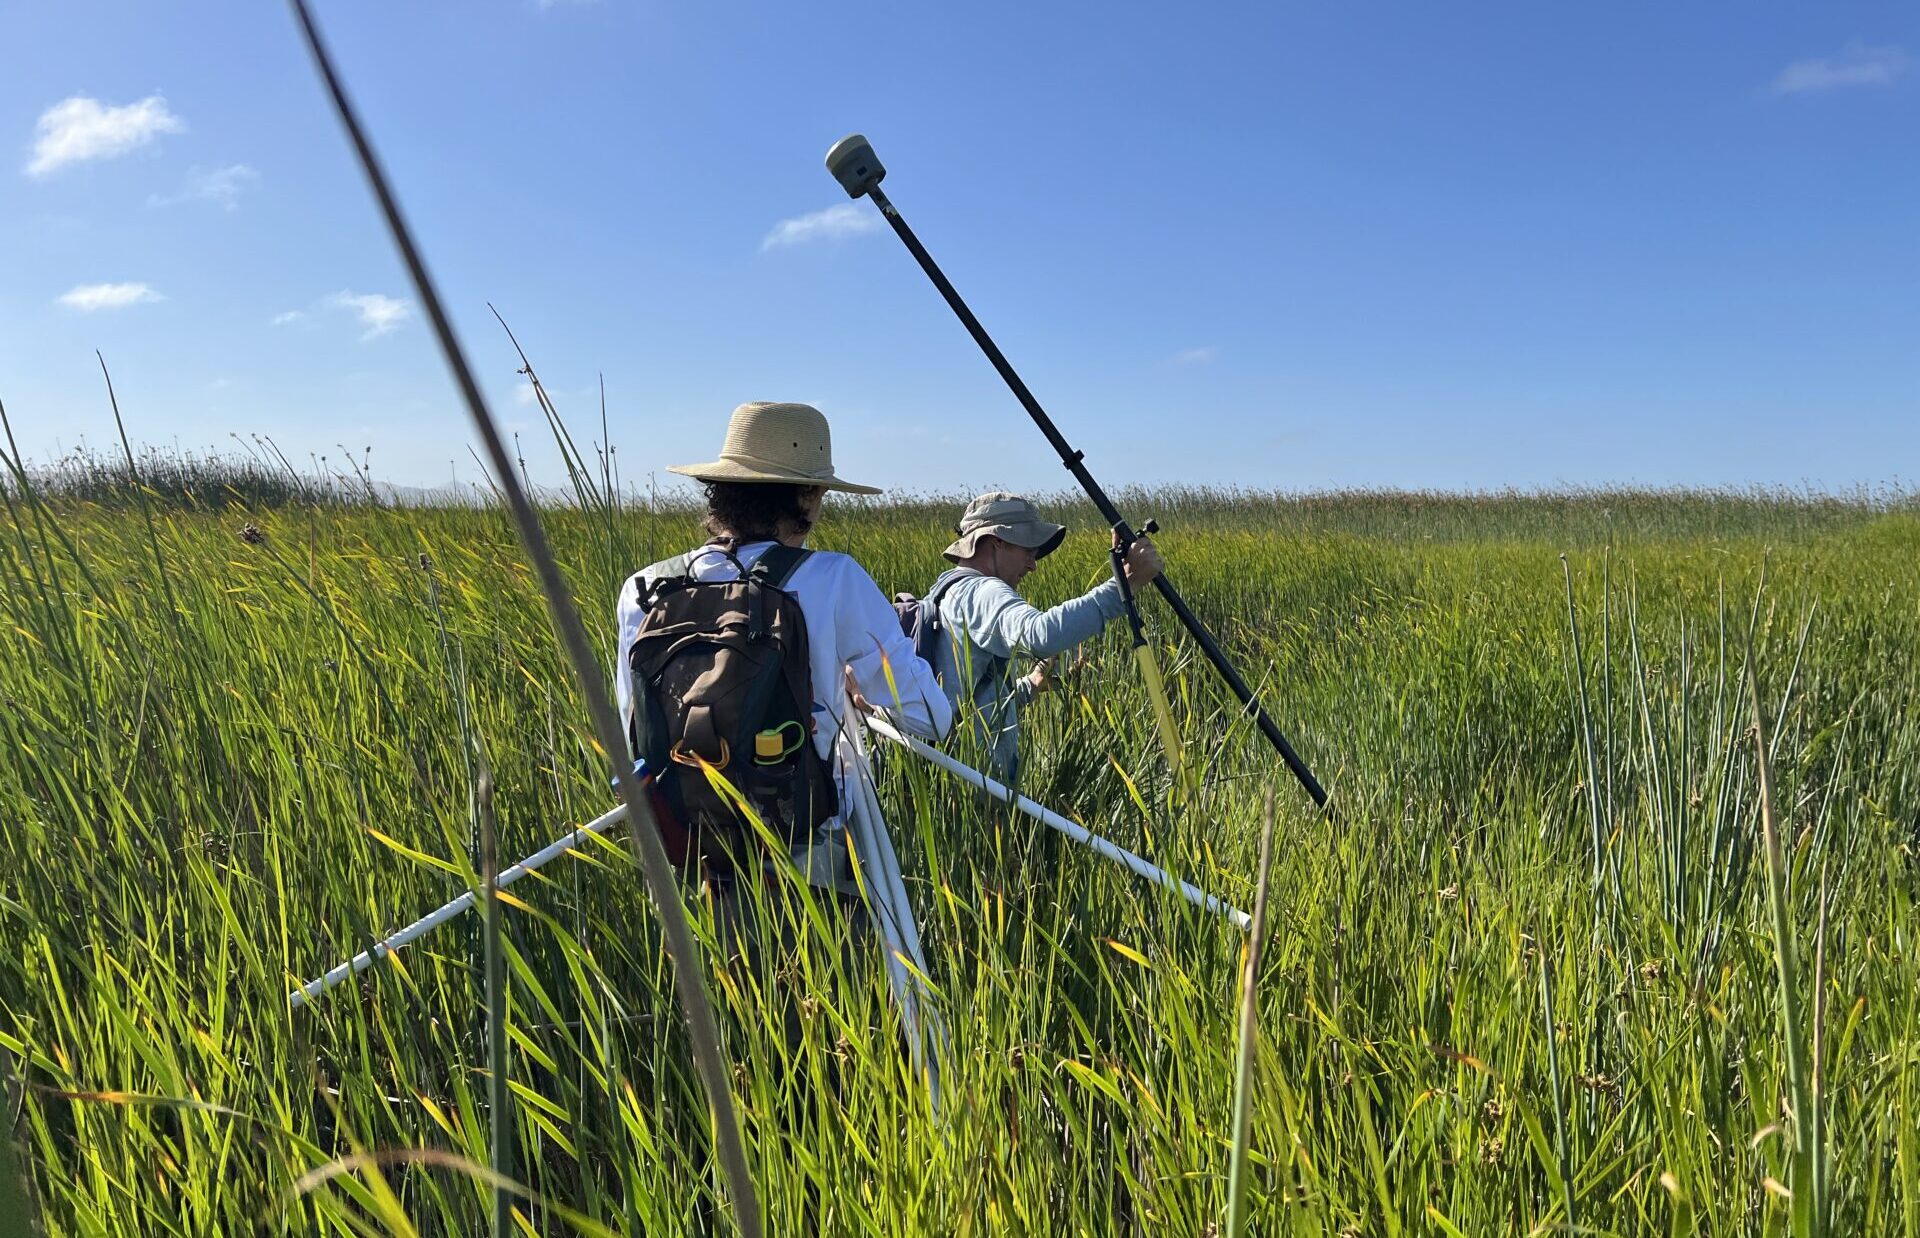
Chris Janousek and Evan Melendez collect RTK points out in the marsh to ground-truth and apply a "vegetation correction" to the lidar based digital elevation model. Photo: Jim Hobbs
So what’s in it for Bay-Delta planners, engineers, ecologists, and policymakers? “This will be a crucial data set for anyone developing sea level rise and shoreline adaptation plans under the RSAP,” says Braud. He points out that instead of cities and counties flying their own lidar to develop plans to comply, they can use the new regional set.
Second, the results of the decades of public investment in tidal wetland restoration around the Bay and Delta should be more apparent. “We want to see if restoration projects are evolving,” says Braud. “The new lidar will give us a better understanding of a site’s micro-topography.”
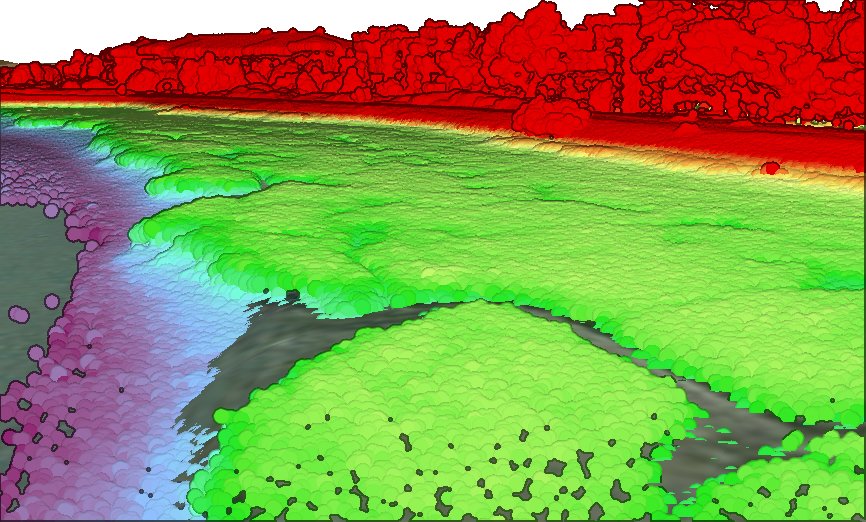
Belmont Slough near Redwood Shores in San Mateo County with colors designed to highlight the change in elevation from tidal slough to marsh to uplands and buildings (purple indicates 0.5-1-foot elevation in NAVD88, red starts around 10 feet, and the tops of the trees in this image are about 45 feet in NAVD88). Image: Alex Braud
In the Delta, hopes for insights from this new survey are similar.
“We’ve done a whole bunch of big scale wetland restoration projects since 2017 — Lookout Slough, Dutch Slough, Big Notch — and physically, the landscape has literally changed,” says Windham-Myers. “With our current hydroclimate, there’s a lot of movement out there in sediments and flows and land elevations. Eight years since the last survey is a good enough chunk of time to see if sites are actually accreting or subsiding.”
DWR, the third major funding partner, is also eager to see the Delta in greater detail. “This dataset will help us assess levee and flood vulnerability, evaluate our habitat restoration efforts in the upper estuary, and understand the region’s response to climate change,” says Louise Conrad, DWR’s lead scientist. “Delivery of the lidar has been an example of true partnership among multiple entities.”
Braud notes that scientists from each funding organization are now doing quality control and assurance work on the lidar data. In the meantime, a rough, interactive representation of the flight paths and elevation results can be found here. The plan is to publish the data in July 2026 on various public portals (CRNA Open Data Portal, NOAA Digital Coast, USGS National Map, and SFEI’s data center).
“We want to do this again in 2028 or 2030,” says Braud. “The first data set is great. But once you get the second, you can really get a clear picture of change across the whole estuary.”